| DISCLAIMER: This article discusses topics at the nexus of investments, annuities, and taxes. This article does not provide and should not be construed as providing tax advice. In order to assess tax benefits specific to annuities, we assume they are held in taxable (non-qualified) accounts unless otherwise specified. |
| OVERVIEW
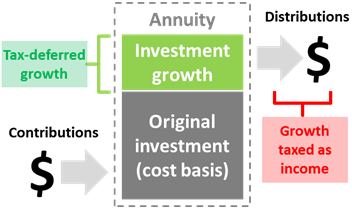
Annuities are popular tools for retirement income planning. While stigmas exist around some annuity products (for good reason), recent research shows how fixed annuities can add value in the context of retirement income. In addition to being able to guarantee income for life, tax benefits are often advertised as a key advantage of using annuities. This article discusses the mechanics of tax deferral in annuity products[1]. We first consider variable and indexed annuities and how the value stemming from their tax deferral can be diluted or even negated due to the growth eventually being taxed as income rather than capital gains. For fixed annuities, this is less a concern as bond interest is already taxed as income. So we explore ways to maximize their tax deferral benefits. We explain the concept of the exclusion ratio and how it relates to the taxation of fixed annuities. We then provide multiple examples and intuition that lead to a novel approach for optimizing tax-efficiency. By exploiting the manner in which the exclusion ratio is applied, we find our approach allows us to reduce taxes by as much as 12% relative to standard fixed income investments for investors with a marginal tax rate of 25%. |
| Figure 1: Tax deferral vs growth taxed as income
Source: Aaron Brask Capital |
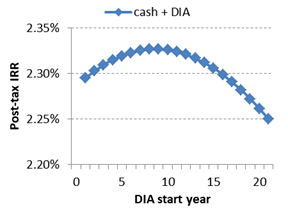
Figure 2: Optimizing tax deferral with DIA start date
Source: Aaron Brask Capital |
Background
Annuities have become a popular tool for retirement income planning. Cynically speaking, we would say commissions have always been a motivating factor for agents to push annuity products – especially the most expensive products. However, that is not to say all annuities are bad. Indeed, some can offer useful benefits. Our research and that from other practitioners and academics highlight many of the advantages fixed annuities can provide to investors and retirees, in particular.
We believe the primary benefit of annuities is their ability to guarantee income throughout one’s lifetime. This is an undeniably attractive feature (and compelling sales pitch) that can only be achieved via annuities[2]. Our concern naturally lies on the cost side of the equation. Indeed, our research and experience indicate the fees associated with more complicated annuity products typically outweigh (or at least dilute) the benefits of guaranteed lifelong income. For example, variable annuities are often saddled with expensive (and in our view, unnecessary) bells and whistles that make them prohibitively expensive.
Of course, insurance companies are in business to profit. So fixed annuities embed costs too. However, we have observed them becoming increasingly competitively priced and suspect this is due to three key factors:
- Their simplicity makes them easy to hedge. Actuaries can use mortality tables to work out the expected cash flows with good precision.
- Their simplicity makes them easy to compare. So it easier for independent insurance agents, like us, to obtain multiple quotes from high quality insurers and find the best value for our clients.
- Annuities help insurers balance longevity risks. For their bread and butter life insurance business, shorter lifespans present a risk because it means they have to pay off liabilities sooner. For annuities, the risk is generally the opposite as longer lifespans translate making more payments.
Our research and experience corroborate the findings from the increasing body of academic and practitioner literature showing that income annuities can add significant value in the context of retirement. On balance, we find these types of annuities to be an extremely useful and cost-efficient planning tool for many retirees. So we are not surprised to see these products becoming increasingly popular.
This article focuses primarily on the tax deferral benefits annuities can provide and is broken down into two sections. The first section discusses how tax deferral benefits are affected by the way annuity earnings are taxed upon distribution (i.e., as income). This is a known issue, but worth repeating. The second section highlights what we believe to be a new and useful strategy to create and maximize expected tax deferral benefits with fixed annuities in taxable accounts.
| Note: To be clear, this article focuses on tax benefits; it does not delve into the absolute costs of annuity products – generally a more important consideration (i.e., do not let the tax tail wag the dog). For example, fixed annuities do not come with price tags outlining their fees. Instead, they embed their costs in their payouts. So it is important to assess their payouts in the context of current interest rates offered by relevant bond investments. Given the technical nature of these calculations (e.g., actuarial/mortality/life tables), we provide both tax and cost analyses to clients interested in annuity (or life insurance) products. |
Annuity tax deferral versus taxes on distributions
One of the benefits of annuity products is tax-deferral. That is, growth is not taxed until it is distributed outside the annuity[3]. This tax deferral is often a major selling point, but there is a downside; the growth or earnings is eventually taxed as income. This can be quite punitive as income tax rates are generally significantly higher than capital gains rates.
Figure : 2020 Income and Capital Gains Marginal Tax Rates[4]
|
Source: IRS
Figure 3 highlights the marginal income and capital gains tax rates for a variety of income levels. The difference between the two becomes greater for higher earners and this can make the tax aspects of annuities less attractive. Let us consider the simple example of $100 invested in a non-dividend-paying stock held by a couple in the highest tax bracket to illustrate the impact. If the stock grew by 10% per year over 10 years, then withdrawing those funds would leave $227.50 in a taxable brokerage account after capital gains taxes. If the same investment was held within an annuity and withdrawn after 10 years, they would end up with just $200.41 due to the gains being taxed at the higher rate (as income).
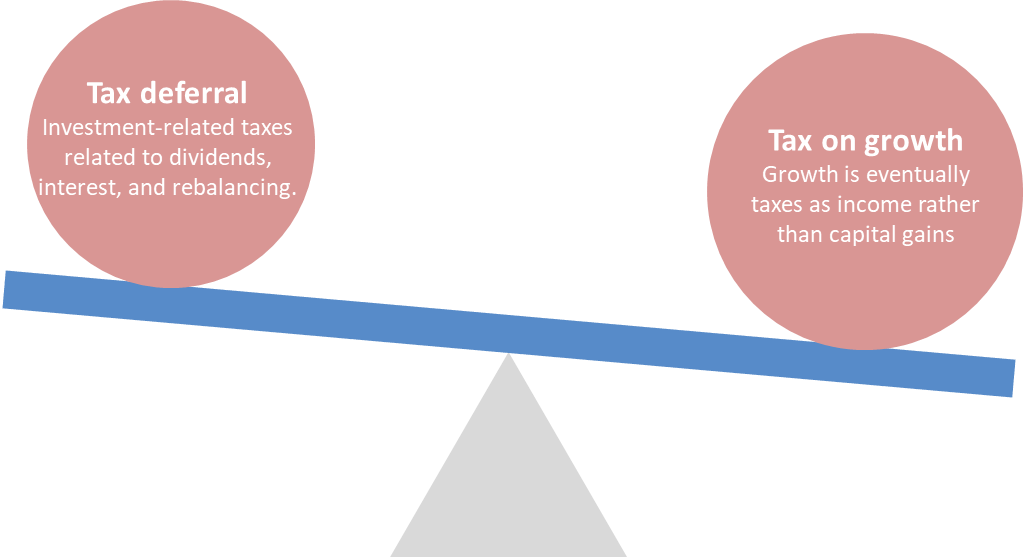
Of course, the above example was contrived to illustrate a point. In most situations, one will hold stocks and stock funds that pay dividends, bonds with taxable interest, and their portfolios will be rebalanced. All of these factors create tax drag when held in a taxable brokerage account, but not within an annuity. The point is that there are two potentially offsetting tax factors at play: the tax deferral during the growth phase and the ultimate tax rate applied to the growth.
Even if we can estimate the impact from the latter factor, there is no simple formula to estimate the impact of tax deferral as the factors we mentioned (dividends, interest, and rebalancing) can be different each year and their impact depends on the investors’ financial and tax situation. Notwithstanding, we used historical simulations to estimate these benefits for various types of portfolios and investors. These results are presented in two articles we published entitled Quantifying the Value of Retirement Accounts and Illustrating the Value of Retirement Accounts. Using the results from these articles, one can estimate the tradeoffs between these two tax factors.
Figure : Balancing Tax Factors
 |
Source: Aaron Brask Capital
There are other factors related to tax that can make annuities less attractive. For example, annuities do not receive a step-up in basis. So their embedded gains will also carry the corresponding tax liability which will eventually be taxed as income as distributions are taken by the beneficiaries.
On balance, we believe the tradeoffs between the tax-related issues highlighted above make annuities inefficient vehicles for most stock allocations[5]. We find the cost of taxing their growth as income (versus capital gains) is simply too high in most situations. However, the tradeoff for bonds is different since their interest and appreciation[6] is already taxed as income. In particular, the tax deferral provided by annuities is still helpful, but taxing their growth as income is not necessarily punitive as it would be taxed that way already without the annuity. The next section discusses how they are taxed and presents a novel approach for optimizing the tax deferral benefits for fixed annuities.
Maximizing tax deferral for fixed annuities
| Note: This section discusses fixed annuities. That is, we focus on annuities whereby one exchanges a lump sum of money for a stream of cash flows that may start immediately or at a later date and may or may not last throughout one’s lifetime. To be clear, our discussion does not include index annuities (a.k.a. fixed index annuities). While index annuities are often grouped together with fixed annuities, they are tied to the performance of one or more underlying indices (e.g., S&P 500) rather than fixed payouts or interest rates. |
This section is broken down into four sections. The first describes three types of fixed annuity products we consider for our analyses. The second section discusses how annuity taxation differs from standard investments in taxable accounts. In particular, it explains the concept of the exclusion ratio and how it can provide tax deferral benefits with annuities. The third section provides examples of how various annuity strategies can be used to exploit the exclusion ratio mechanics and improve one’s after-tax outcomes. The fourth section delves deeper into these strategies to optimize the results based on where DIA cash flows start.
Types annuity products we analyze
We consider three primary fixed annuity products to assess tax efficiency versus using standard interest-bearing investments in taxable accounts. The first product is called a single premium immediate annuity (SPIA). This involves paying an upfront lump sum of money in exchange for cash flows that will start immediately (typically with 12 months) and continue until the annuitant passes. The second product, a deferred income annuity (DIA), is similar to a SPIA in that it is funded with an upfront lump sum, but its cash flows are deferred and start at a later date (typically after at least 12 months).
For SPIA and DIA products, we assume they embed a feature known as a cash refund. This will insure these annuities always return at least as much premium as was invested. We find this is a desirable option in practice, but it also makes the annuities more comparable to cash allocation strategies since they would both leave cash balances if the annuitant passed before their expected lifespan.
The third product is a multi-year guarantee annuity or MYGA (a.k.a. a fixed rate annuity since the rate of interest is fixed upfront). In effect, a MYGA can be used to purchase a future cash flow at a discount. This is similar to a zero-coupon bond or certificate of deposit (CD) whereby you select a desired maturity, invest your money, and then that money grows until its maturity according to the embedded interest rate. However, the MYGA also provides tax deferral.
We also analyzed fixed period annuities. Like SPIAs and DIAs, one pays for a fixed period annuity upfront and receives a stream of income. However, the income is limited to a pre-specified period and is not guaranteed throughout one’s life like SPIAs and DIAs. We use a fixed period annuity in an example below to illustrate annuity tax deferral benefits, but we did not include their results in the main analysis further below because they were only marginally different than the other products we considered.
Fixed annuity tax basics (the exclusion ratio)
In order to understand the tax benefits annuities can provide, we make some simplifying assumptions:
- A fixed interest rate of 3%
- A flat income tax rate of 25% applies to bond interest
Now let us consider an investor who would like to allocate enough cash[7] to provide after-tax proceeds of $10,000 per year for 10 years. Given that each dollar invested will earn 2.25% after tax (3% gross return net of 25% tax), netting $10,000 N years later requires an initial amount of capital equal to $10,000 ÷ (1 + 2.25%)N. In our case, the total capital required to fund 10 years of $10,000 spending works out to $88,662.
In year one, there will be $2660 (3% x $88,662) of interest on our cash portfolio, $665 (25%) taxes will be paid on that interest, and the investor will withdraw $10,000. This (and every) withdrawal is larger than the after-tax interest. So a portion of each withdrawal will come from the principal and naturally deplete the capital over time (by construction, it will go to zero after 10 years). As a result of the reduced principal, the amount of taxable interest will be highest early on and decrease each year.
Figure : Tax profile illustrations
| Taxable cash allocation (front-loaded taxation)
|
Fixed period annuity (level taxation)
|
Source: Aaron Brask Capital
Fixed annuities offer an advantage relative to this front-loaded taxation. The IRS[8] effectively allows for level taxation of income annuities via a calculation based on the exclusion ratio. The exclusion ratio is calculated and provided as part of an annuity contract in order to determine how much of each distribution will be excluded from taxation. It is intuitively calculated as the amount of the original investment divided by the total expected payout[9] (original investment + return).
Figure 5 above illustrates the tax profiles for a cash allocation designed to generate the same after-tax $10,000 per year versus a fixed period annuity paying the same cash flows over a 10-year period. The benefit of the level taxation an annuity can provide is that it translates into lower taxes in the beginning (relative to the front-loaded taxation of interest-bearing cash) – thus allowing for more tax-deferred compounding. The benefit of this extra tax deferral is minimal in this example (i.e., the fixed period annuity tax deferral only saved $106), but the next section investigates strategies to make the benefits more significant.
Leveraging exclusion ratio mechanics to improve tax deferral
Now that we have explained the concept of the exclusion ratio and how it works, we look at ways to use it to our advantage. The context for this discussion will be a 65-year-old female retiree who would like to generate $10,000 of after-tax income per year for the rest of her life.
We naturally cannot predict how long she will live. So it is impossible for us to know how much cash one would need to allocate and compare to annuity strategies with lifelong income. However, this turns out to be irrelevant for this analysis since the exclusion ratio and its tax deferral benefits only apply throughout one’s actuarially expected lifespan.
| Note: Annuity income becomes 100% taxable if one lives beyond their expected lifespan because all principal has been returned by then. That is, further income is 100% return and thus 100% taxable. However, taxation becomes an ancillary issue as the primary benefit of an income annuity at this point stems from the fact there is any income at all to be taxed (i.e., the cash allocation strategy would be depleted). |
Accordingly, one’s expected lifespan is the only period we need to consider and we can thus determine the specific amounts required to construct our baseline cash allocation strategy for comparison. We use an expected lifespan of 20 years for our hypothetical 65-year-old female retiree[10]. As a base case, the cash allocation strategy requires $159,637 to generate $10,000 per year for spending (i.e., after tax).
In order to compare the results from different strategies, we utilize a methodology similar to that used by Joe Tomlinson (actuary and retirement researcher) in this article. That is, we calculate the internal rate of return (IRR) of each strategy on an after-tax basis. To be clear, we generate the same $10,000 after-tax income per year and assume the same pre-tax rate of return. So the difference in initial investment required for each approach will be a direct result of its tax deferral benefits and be reflected in its post-tax IRRs (i.e., higher IRRs indicate more deferral and tax efficiency).
Figure : Comparing after-tax IRRs
| After-tax IRR | Effective tax rate | Effective tax cut[11] | |
| Cash allocation | 2.25% | 25.0% | 0% |
| SPIA | 2.30% | 23.5% | -6% |
| Cash allocation + DIA | 2.33% | 22.5% | -10% |
| MYGA ladder + DIA | 2.34% | 22.1% | -12% |
Source: Aaron Brask Capital
We also use the after-tax IRR to calculate and compare the effective tax rates[12] of these strategies. For reference, cash allocations involve no tax deferral. So their effective tax rate and after-tax IRR will always be precisely 25% and 2.25% (3% return net of 25% income tax), respectively.
We now consider three alternative approaches using fixed annuities. The first approach we consider is the simple SPIA. The benefit of its level taxation results in an after-tax IRR of 2.30%. This is a slight improvement over the 2.25% after-tax return of the cash strategy and reduces the effective tax rate from 25% to 23.5%.
The next two approaches break the 20-year period into two 10-year periods. While both use a DIA for the latter period, we provide income for the first 10 years in two different ways: via a cash allocation and a ladder of individual MYGAs. Recall from our description above that MYGAs are annuities that allow one to invest a sum of money with a pre-specified interest rate over a particular multi-year period of time – similar to CDs or zero-coupon bonds.
Each approach is taxed differently and thus yields different after-tax results. We present these results next to those for the cash allocation strategy and SPIA in Figure 6 above. Just as the SPIA’s level taxation improved the tax deferral benefits versus the cash allocation, introducing the DIA further improved the results by completely deferring taxes for the first 10 years and then leveling the accrued taxes over the latter 10-year period.
It is worth noting the cash allocation for the first 10 years suffered from the same tax front-loading issue, but was only relevant to just over half of the overall investment with the balance being invested in the DIA. This front-loading tax issue was addressed by using the ladder of MYGAs. In fact, the annuity ladder actually back-loads the taxation[13] and creates an even more favorable result than level taxation would have.
Figure : Tax profile illustrations
Fixed period annuity (level taxation)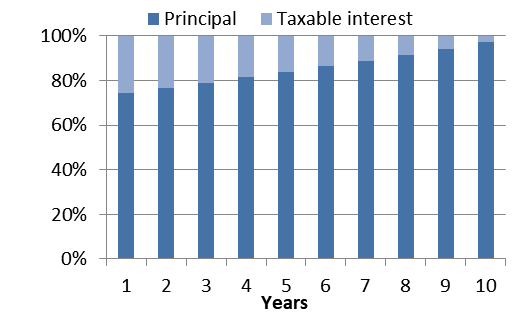 |
MYGA ladder (back-loaded taxation)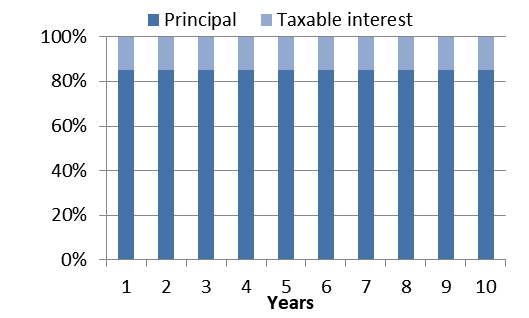 |
Source: Aaron Brask Capital
Using the DIA with a cash allocation for the first 10 years increased the after-tax IRR from 2.30% for the SPIA to 2.33% with the DIA and reduced the effective tax rate by another full percent[14] to just 22.5%. Replacing the cash allocation with the MYGA ladder further increased the after-tax IRR to 2.34% and reduced the effective tax rate to 22.1%.
In summary, the above strategies were able to increase the after-tax IRRs by just under nine basis points (0.09%). While this figure may sound small, it is amplified to the extent it applies to all of the compounding for all of the cash flows from year one to year 20. Another way to look at it is to consider the absolute amount of taxes paid on the investments. In this context, the benefit of the annuity tax deferral was able to reduce overall taxes paid by as much as 12%.
Optimizing
Now that we have observed how the exclusion ratio and corresponding tax deferral benefits differ for various approaches, we explore a simple strategy to try and maximize those benefits. In our previous examples, we split the 20-year period into two equal halves and seemed sensible. However, this 10-10 split was still arbitrary. Following along with our hypothetical 65-year-old female retiree, we assume the same 20-year period as before, but we alter the point at which we start the DIA cash flows and see how it impacts the results.
We first look at the approach using the cash allocation with a DIA. The following two charts show how changing the DIA starting year impacts the after-tax IRR and effective tax rate. It is worth nothing that starting the DIA in year one is equivalent to the SPIA approach and starting it after year 20 is equivalent to the cash allocation approach (no annuity). The dark blue lines in Figure 8 represent this approach and indicate the IRR is maximized (and the effective tax rates is minimized) when the DIA is started in year nine. So the 10-year DIA start we used before turns out to be near optimal when combining it with a cash allocation.
Figure : IRR and effective tax rate for varying DIA starting dates
IRR |
Effective tax rate |
Source: Aaron Brask Capital
We repeated the same analysis for the approach with a MYGA ladder and DIA. Those results are represented by the light blue line in Figure 8 above. In this case, the IRR increased and the effective tax rate decreased in a monotonic fashion from years one to 20. This is a direct result of the favorable (back-loaded) taxation the MYGA ladder offers. As the charts indicate, the marginal benefit of starting the DIA later is significant in the early years, but diminishes through time. As a result, it may be sensible to start the DIA around 10-year mark as there is minimal benefit beyond that point (e.g., to ease the administrative burden involved with filling out 20+ annuity applications). Alternatively, one could utilize a fixed period annuity instead of the MYGA ladder. This achieves much of the tax deferral benefit via its level taxation, but only requires a single application.
Concluding remarks
This article focused on tax-related aspects of annuities, but we do not advocate letting the tax tail wag the dog. There are, of course, many other important factors one should consider. Indeed, we find the fees and embedded costs associated with many products make them prohibitively expensive – regardless of their tax-efficiency or other benefits. Liquidity constraints and surrender penalties should also be considered.
Our research and experience indicate fixed annuity products can be both cost- and tax-efficient tools for retirement income planning. The embedded costs of fixed annuities are specific to each policy (age, gender, current market rates, etc.) and should be considered on an individual basis. However, the rules governing their taxation do not change and that is why this article focused on strategies to maximize their tax efficiency.
Below we list what we believe are the primary points made by this article. We also highlight several other non-tax-related points we did not discuss, but are also worth considering in the context of annuities.
Primary points made in this article
|
Additional points unrelated to taxes
|
Notes (the good, the bad, and the ugly of annuities)
- The topic of annuities is often polarizing and many of the stigmas attached to them are for good reason (e.g., advice is often biased to favor products with higher commissions versus a fiduciary mindset).
- I have a PhD in mathematical finance and started out along an actuarial track. In my previous career, I worked with different insurance companies to hedge risks within their annuity books.
- Having worked with individuals and families over the last decade, I have reviewed many portfolios and seen the negative impact from various high-commission and poor performing insurance products.
- So I have seen the good, the bad, and the ugly in the context of annuities and life insurance.
Disclaimer
- This document is provided for informational purposes only.
- We are not endorsing or recommending the purchase or sales of any security.
- We have done our best to present statements of fact and obtain data from reliable sources, but we cannot guarantee the accuracy of any such information.
- Our views and the data they are based on are subject to change at any time.
- Investing involves risks and can result in permanent loss of capital.
- Past performance is not necessarily indicative of future results.
- We strongly suggest consulting an investment advisor before purchasing any security or investment.
- Investments can trigger taxes. Investors should weight tax considerations and seek the advice of a tax professional.
- Our research and analysis may only be quoted or redistributed under specific conditions:
- Aaron Brask Capital has been consulted and granted express permission to do so (written or email).
- Credit is given to Aaron Brask Capital as the source.
- Content must be taken in its intended context and may not be modified to an extent that could possibly cause ambiguity of any of our analysis or conclusions.
- While this article highlights annuity strategies to maximize the tax efficiency, one must consider the bigger picture including price paid and value delivered. As we highlight multiple times within the article, taxes are just one consideration. ↑
- Insurance companies are the only entities that can provide payouts based on lifespans (e.g., life insurance and lifetime income). ↑
- Please see IRS Publication 575. ↑
- These figures assume married filing jointly (MFJ) status and do not include standard or itemized deductions, the net investment income tax, or Medicare surcharge. ↑
- We are referring to standard equity portfolios and strategies – as may generally be found in tax-efficient exchange traded funds. However, the tax deferral benefits may be suitable for more complex, higher-turnover (i.e., tax-inefficient) strategies. ↑
- Bonds purchased at a (market) discount will appreciate toward par and this appreciation is generally taxed as ordinary income. ↑
- Given we are assuming a fixed interest rate, the math for the interest and taxes works out the same whether one views this as a ladder of bonds over the 10-year period or a money market account with the same initial capital. ↑
- See IRS Publication 939 for specific details. ↑
- In the case of lifelong income (immediate or deferred), the expected payout is based on one’s actuarially expected lifespan. However, payments beyond the expected lifespan will be fully taxable. ↑
- Social Security actuarial tables indicate 20.49 years. ↑
- Relative to the cash allocation approach with the original 25% tax rate. ↑
- In line with Tomlinson, we calculate the effective tax rate as the difference between the before- and after-tax IRRs divided by the before-tax IRR. That is, effective tax rate = [ BT_IRR – AT_IRR ] ÷ BT_IRR. ↑
- This is a result of using 10 different annuities each with their own exclusion ratio. In practice, this involves 10 (well, 11 if we include the DIA) annuity applications. Given the administrative burden this may impose, the aggregation rules around annuities purchased within the same year, and the slight marginal benefit, one may prefer to replace the MYGA ladder with a single fixed-period annuity. ↑
- To be clear, this is an absolute reduction in the effective tax rate; we could have been more dramatic by claiming this reduced the taxes by 4.2% (22.5% ÷ 23.5% – 1). ↑
- A QLAC is effectively a deferred income annuity inside a qualified retirement account. ↑


