Dividends: Theory and Empirical Evidence

Here is a link to the PDF: Dividends: Theory and Empirical Evidence.
OVERVIEW

Building on the concepts presented in our Dividends Are Different article, here we present data and observations highlighting how dividends can protect investors from inflation and market volatility. While this content is relevant to other applications, we focus on it within the context of retirement income.

When designing portfolios to provide for retirement, conventional wisdom holds that allocations to stocks generally facilitate growth that helps hedge against inflation. We agree with this notion, but try to make it more concrete by highlighting the fundamental and market-based mechanics behind this relationship.

We then look at empirical data to investigate how inflation relates to market prices, earnings, and dividends. We measure results over 25-year time periods – fairly typical horizons for retirement planning. Our findings reveal impressively strong relationships between fundamental performance and inflation, but an unsurprisingly weaker linkage between market returns and inflation.

Relative to chiseling away from a portfolio, we believe dividends provide a more direct tool to combat inflation as they avoid the layer of noise imposed by often-volatile market prices. This can be especially important when inflation surfaces as asset prices may react negatively – thereby requiring higher withdrawals when asset prices are depressed. This situation can impose permanent damage on retirement security and is why retirement researchers identify inflation as such a critical risk.

Figure 1: Correlation with inflation (25-year periods since 1880)

Source: Robert J. Shiller market data, Aaron Brask Capital

Outline

This article is organized in three primary sections followed by our concluding remarks. The first section highlights theory and mechanics that relate inflation to stocks price movements. The second section quantifies these notions and presents our empirical findings. The third section discusses the potential roles dividends can play in the context of addressing and managing market risk.

Theory relating inflation to stock price movements

When it comes to investing for retirement, conventional wisdom holds that allocations to stocks generally facilitate growth that helps hedge against inflation. The following highlights what we believe are the key fundamental and market-based mechanics that drive this relationship.

At the root level, shares of stock represent profit-seeking enterprises and these businesses require capital to acquire resources (e.g., PP&E[1], raw materials, and labor), alter or assemble them, and turn them into something they can sell to their customers. This capital naturally demands a return. Thus, as inflation increases input costs, maintaining the required return on this capital will increase the absolute level of profit. Put simply, profits should rise with inflation under these assumptions.

Of course, economic forces do not follow a set schedule or formula. Innovation and competition involve much trial and error. Moreover, companies ultimately rely on humans to make decisions. On an individual basis, this introduces some subjectivity into their fundamentals. However, the level of entropy is increased as they interact and create feedback loops. The bottom line is that the inflation-profit model described above will naturally involve significant noise.

Notwithstanding this randomness, as long as survival instincts, profit motives, and competition exist, the above logic regarding returns on capital will apply and help explain why profits, and thus stock prices, should be positively correlated with inflation over the longer term.

“In the short run, the market is a voting machine but in the long run, it is a weighing machine.”

– Benjamin Graham (Warren Buffett’s mentor)

While the relationship between inflation and profits is already noisy, market-based forces make the relationship between inflation and stock prices more tenuous. We firmly believe prices follow fundamental performance over the long term. However, investor sentiment can influence prices over shorter periods. This notion is particularly relevant in the context of inflation. Historically, we have witness periods where investors reacted negatively to significant bouts of inflation and we suspect that is due to them assuming (implicitly or explicitly) a higher interest rate is warranted for discounting future cash flows. However, this reaction ignores the phenomenon we highlighted above and will illustrate below with historical data – i.e., that inflation appears to give rise to increasing profits over the longer term.

“Inflation is truly the great enemy of the retiree.”

– William Bengen[2]

In the context of retirement, inflation can require one to withdraw more money to maintain the same standard of living. Moreover, the threat is magnified to the extent that a sustained uptick in inflation can increase prices for the remainder of one’s retirement. Even worse, negative market reactions during inflationary periods can add further risk to this situation. On the one hand, inflation may force an increase to the dollar amount of portfolio withdrawals. On the other hand, each dollar of withdrawal may require selling more shares or bonds in an environment where their prices are depressed. This is why academics and practitioners view inflation as such a significant threat to retirement security.

Empirical results

The goal of this section is to illustrate the historical relationship inflation has had with corporate fundamentals (i.e., earnings and dividends) and stock prices. We use Robert J. Shiller’s online data for S&P 500™ prices, earnings, and dividends. We start out by investigating these relationships over 25-year time periods as we believe this can help us address some of the noise highlighted above and identify longer term trends. Moreover, 25 years is a reasonable period to consider in the context is retirement planning.

Figure 1 on the front page shows how stock prices, earnings, and dividends were correlated with inflation over 25-year periods. It shows impressively strong relationships between fundamental performance and inflation, but an unsurprisingly weaker linkage between market returns and inflation. S&P 500 returns were 58% correlated with inflation while earnings and dividends exhibited correlations of 64% and 83%, respectively.

Figure 2: Standard deviation of growth rates (25-year periods)
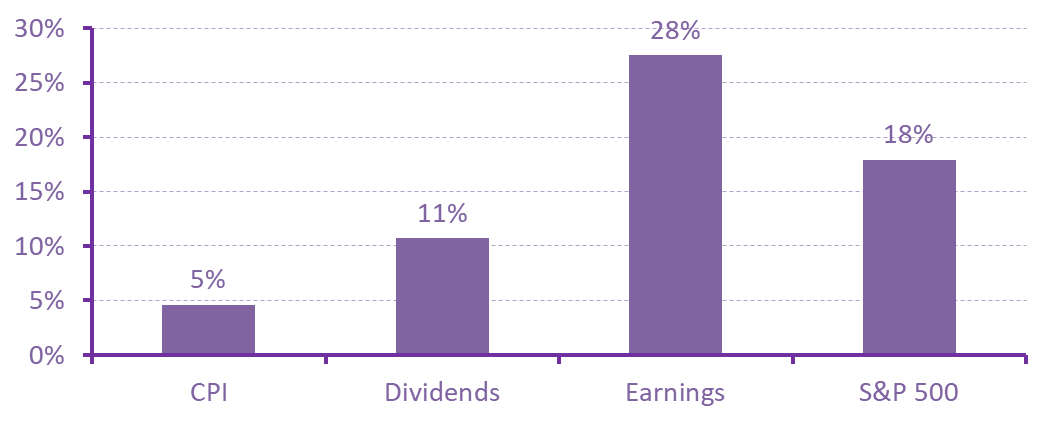
 

Figure 1: Correlation with inflation (25-year periods since 1880)

Source: Robert J. Shiller market data, Aaron Brask Capital

We also calculated how volatile these quantities were by measuring the standard deviation of their growth rates.[3] Figure 2 above shows these results. CPI exhibited the least volatility with a standard deviation of 4.6%. We suspect this primarily due to the slow-moving forces of supply and demand, but hedonic adjustments to CPI figures[4] and central bank mandates for price stability may also be factors. The standard deviations for dividends, earnings, and S&P 500 prices were all higher at 10.7%, 27.5% and 17.9%, respectively.

Interestingly, earnings showed the highest volatility. We believe this is due to the apples-oranges nature of the comparison. For example, each earnings figure represents the profits of the underlying companies reported over a particular period. However, market prices represent an average of expected earnings over many different periods. Moreover, earnings figures can be arbitrarily small over some periods (no negative readings in the data we used). Thus, percentage-based growth figures calculated from lower levels may accelerate rapidly. It is also worth noting that dividend volatility might also be lower due to the discretion CEOs and CFOs have in declaring dividends. Indeed, they have the ability to dig into retained earnings and pursue what they expect will be sustainable dividend policies despite fluctuations in their earnings.

Even if they exhibited the highest correlations with CPI or the lowest level of volatility, earnings are not accessible, except to the extent they are paid out as dividends. That is, only share prices and dividends represent tangible, liquid money investors can use for spending. As such, earnings are effectively irrelevant in the context of retirement where one requires liquidity.

Figure 3: Dividend and inflation growth over rolling 25-year periods (annualized)
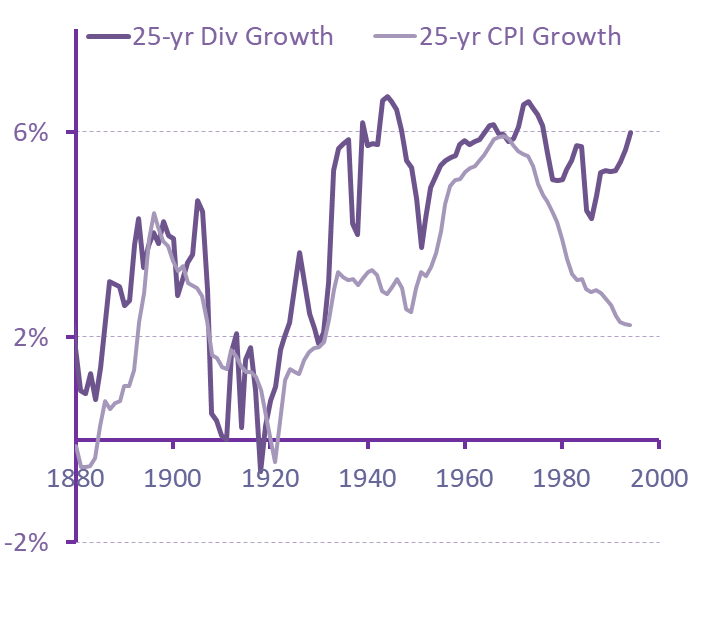
 

 Figure : Dividend and inflation growth over rolling 25-year periods (annualized)  Figure : Dividend and inflation growth over rolling 25-year periods (annualized)

Source: Robert J. Shiller market data, Aaron Brask Capital

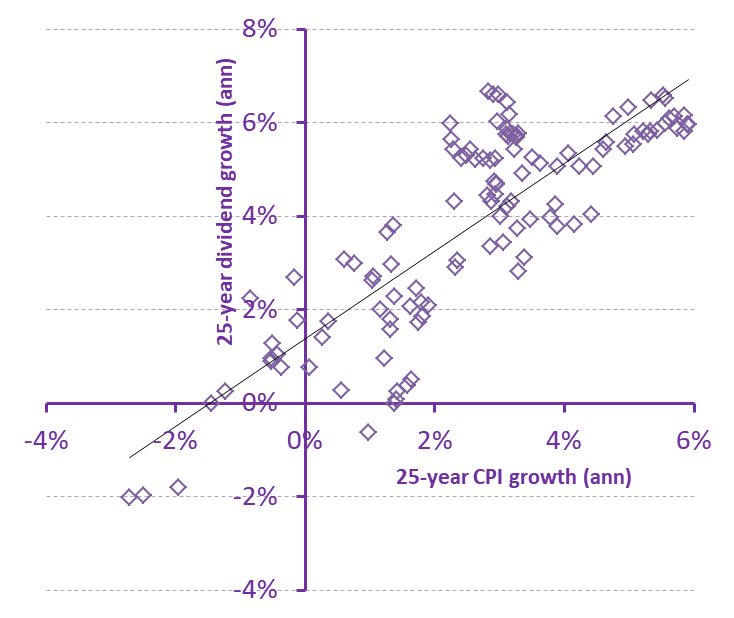
Figure 3 above provides two visualizations of the 25-year growth rates for S&P 500 dividends and the consumer price index (CPI). The first chart on the left shows how the 25-year growth rates for dividends and CPI evolving through time. While they broadly followed each other, the most recent data show inflation trending lower while dividend growth rates have sustained their near-peak levels. The second chart shows the same data in scatter chart. We believe this chart reveals at least one key point. In periods where CPI grew the most (data points to the right), dividends also grew at a significant rate. This would have been particularly important to those relying on dividends for retirement income since the growth in dividends would have been there when it was needed most.

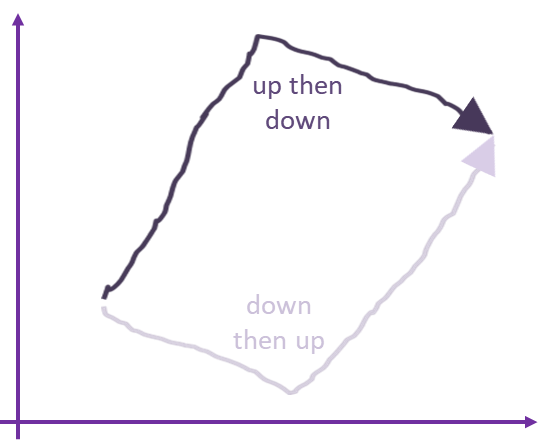
The above calculations utilized growth rates from 122 overlapping 25-year windows spanning the 1872-2019 period. In particular, each growth rate depended only upon its starting and ending value. Thus, even if the dividend/inflation correlation of 25-year windows was high, the intra-period trajectories of these quantities could be divergent. Figure 4 in the left panel below illustrates a hypothetical example of a period whereby the end result was the same for two quantities, but the trajectories were very different.

In order to assess the relationship between dividends and inflation at a higher resolution (i.e., within the 25-year periods), we made similar observations over smaller periods. Figure 5 shows the correlations calculated for rolling time periods ranging from five to 25 years. To be clear, the 25-years correlations in Figure 5 are the same as those presented in Figure 1. As expected, correlations increase with longer time periods. We attribute this to the noise we highlighted while discussing the theoretical underpinnings of this relationship (e.g., companies might temporarily absorb price increases before passing them on to their customers). Dividends show the highest correlations regardless of the time period chosen. Moreover, while not shown here, correlations between CPI and dividends fell to 34% for one-year time periods but increased to 95% with 50-year periods. On balance, we believe this indicates a strong relationship between dividends and inflation.

Figure 4 : Same result via two different trajectories

Figure : Same result via two different trajectories

Source: Aaron Brask Capital

Figure : CPI correlations for different size periodsFigure 5: CPI correlations for different size periods

Source: Robert J. Shiller market data, Aaron Brask Capital

To summarize, we highlight a few key points related to inflation:

  • Natural economic forces impose a cause-and-effect relationship that make inflation positively correlated with corporate fundamentals and stock prices.
  • Relative to market prices and earnings, dividends have been the least volatile and exhibited the strongest correlations with inflation.
  • We believe these relationships are likely to sustain and dividends can provide a robust option for retirees and other investors seeking income that will keep up with inflation.

Dividends and market volatility

In the previous sections, we shared our conceptual model and data indicating how inflation relates to corporate fundamentals and stock prices. This section highlights two roles dividends can play in mitigating risks related to market volatility.

The first context focuses on using dividends as a source of income versus having to chisel away at a portfolio’s principal and thus being at the mercy of the market. Dividends depend on underlying operating performance of the company but are not at the mercy of fickle investors’ buying and selling. So this can reduce one’s dependence on market performance (see our Dividends Are Different article).

Note: Our next article will revisit this notion of mitigating dependence on market performance as it can apply to fixed income allocations as well.

The second context focuses on reducing rather than avoiding market volatility. Indeed, we believe dividends can be used to identify companies with higher quality fundamentals and less market volatility. However, not all dividend strategies are the same. There are two primary types of dividends strategies and they are effectively polar opposite in nature. Given the proliferation of indices, ETFs, and dividend-related products, it is easy to get confused. So we describe these two dividend strategies in the shaded boxes below.

High dividend yield strategies

Many dividend-based products and strategies target stocks that are paying high dividend yields. These are usually stocks that pay dividends, but have run into troubles – thereby sending their share price lower and making their dividend yield higher. Investors generally take notice of successful companies that consistently increase their earnings and dividends. This can keep their prices elevated and make their dividend yields lower. Accordingly, we find high dividend yield strategies often result in portfolios comprised of lower quality companies.

Rising dividend strategies

The second type of dividend strategy we highlight targets stocks that have consistently paid and raised dividends for an extended period. While these companies may have lower dividend yields, the quality of the underlying companies is typically much higher – as evidenced by their ability to pay and increase dividends. Accordingly, this approach is very different than pursuing higher dividend yields.

For our purpose of investigating how dividend strategies can impact market performance, we focus on the latter dividend strategy. Our hypothesis is that companies that have consistently paid and raised their dividends are, on average, higher quality and exhibit lower market volatility. For this purpose, we consider the Vanguard Dividend Appreciation ETF (ticker: VIG). As the name indicates, this fund invests in companies that have records of growing their dividends. Moreover, it has a live track record going back to April 2006. So we can observe performance over at least one complete market cycle.

Of course, this is just one fund. So the evidence may appear anecdotal in nature. However, our research reflects similar trends whereby portfolios of higher quality companies tend to exhibit lower market volatility and reduced drawdowns – regardless of whether they pay dividends or not. We first present quantitative evidence indicating companies with histories of increasing dividends are high quality in nature. This is an obvious and unsurprising finding to us, but some prominent practitioners and academics maintain that dividend policies provide little, if any, useful information for investing purposes.

We used www.PortfolioVisualizer.com to examine our assertion regarding the quality of these types of companies and calculate key performance figures for returns, volatility, and drawdown.[5] Figure 6 below shows the tabular results from running the Fama-French five-factor regression for VIG. In layman’s terms, this model compares the historical performance of VIG to the performance of various factors portfolios (i.e., portfolios built to emphasize stocks with those specific factors) to statistically determine what flavors of stocks are in VIG. Technical details aside, the model indicates a significant and almost certain exposure to quality stocks as we suspected (profitability loading of +0.21 and p-value of 0.0%).

Figure 6 : Fama-French factor attribution for Vanguard Dividend Appreciation ETF (ticker: VIG)Figure 6 : Fama-French factor attribution for Vanguard Dividend Appreciation ETF (ticker: VIG)

Source: www.PortfolioVisualizer.com

We believe the above results show how dividends can be used to identify higher quality companies. We now investigate how this is related to their market performance. We are particularly interested in how these types of stocks held up during turbulent periods. Figure 7 below shows the additional output from PortfolioVisualizer. Since its inception in 2006, VIG 8.92% on an annualized basis and this was almost identical SPY (an S&P 500 ETF) which returned 8.65%. However, the volatility and drawdown of VIG were both significantly lower than for SPY. The standard deviations of their returns were 12.75% for VIG and 14.52% for SPY and their drawdowns were -41% and -51%, respectively. This drawdown data is anecdotal since it only represents one particular event. So we investigated the data for the benchmark index VIG targets (NASDAQ US Dividend Achievers) and found similar results. While these results were actually stronger, it is worth noting that they were based on an index back-test rather than a live track record.

Figure 7: Vanguard Dividend Appreciation ETF (ticker: VIG) factor attribution

Figure 7: Vanguard Dividend Appreciation ETF (ticker: VIG) factor attribution

Source: www.PortfolioVisualizer.com

While some refuse to accept any role for dividends in portfolio construction or management, our intuition and historical data lead us to believe such views are dogmatic. We believe dividends possess important attributes with regard to inflation and market volatility that allow them to play a unique and critical role, especially in the context of retirement income planning.

Concluding remarks

This article first presented our theoretical model for how inflation relates to both corporate fundamentals and share prices. We then shared empirical results showing how dividend growth has been more strongly correlated with inflation than stock market returns or earnings growth. We also discussed and presented data describing how dividends could be used to bypass and possibly reduce stock market volatility.

We believe the empirical results regarding inflation corroborate the ideas behind our economic model as well as the notions we discussed in our previous article, Dividends Are Different. In particular, dividends are fundamental in nature and represent an economic phenomenon that is distinct from market prices and share buybacks.

At this point, refusing to acknowledge these unique attributes of dividends is effectively alleging the correlations we calculated were just a coincidence or manipulated by corporate managements. Given that these trends occurred over multiple time periods, we think the possibility of coincidence is de minimis. Moreover, that would be quite a conspiracy. Executives of companies from all sectors and across many time periods would have had to collaborated so that their dividend policies would aggregate in just such a way to conform to inflation trends over multi-decade periods.

We do not subscribe to any such conspiracies. We believe the dividend-inflation trends we highlighted represent a visible hand of capitalism at work as required returns on capital effectively push inflation through the economy’s profit mechanism. Since dividends are taken out of profits and paid to directly to investors, they are not subject to the sentiment of often-fickle investors. This is especially important since investors can react negatively to inflation and send market prices lower at a time when liabilities may be rising. As such, we believe they provide a better source of income for investors who have liabilities that will likely grow with inflation.

We believe retirees, in particular, can leverage the benefits of dividends we highlighted in this article to combat the deleterious effects of inflation and market volatility. Indeed, our next article will outline an innovative approach to retirement income that leverages these notions and can yield significant advantages over standard withdrawal methods in the contexts of costs, risk, performance, taxes, and transparency.

Disclaimer

  • SET IT AND LEAVE IT ™ is an investment strategy developed by Aaron Brask Capital, LLC.
  • This document is provided for informational purposes only.
  • We are not endorsing or recommending the purchase or sales of any security.
  • We have done our best to present statements of fact and obtain data from reliable sources, but we cannot guarantee the accuracy of any such information.
  • Our views and the data they are based on are subject to change at any time.
  • Investing involves risks and can result in permanent loss of capital.
  • Past performance is not necessarily indicative of future results.
  • We strongly suggest consulting an investment advisor before purchasing any security or investment.
  • Investments can trigger taxes. Investors should weight tax considerations and seek the advice of a tax professional.
  • Our research and analysis may only be quoted or redistributed under specific conditions:
    • Aaron Brask Capital has been consulted and granted express permission to do so (written or email).
    • Credit is given to Aaron Brask Capital as the source.
    • Content must be taken in its intended context and may not be modified to an extent that could possibly cause ambiguity of any of our analysis or conclusions.
  1. PP&E stands for property, plant, and equipment.
  2. This quote comes from Chapter 1, page 14 of William Bengen’s book Conserving Client Portfolios During Retirement (link).
  3. We calculated intra-period standard deviations for each 25-year window and took an average. Standard deviations calculated over the entire 1872-2019 period show similar results, but we chose to present the average of intra-period standard deviations to account for potentially changing inflation regimes (i.e., the mean used to calculate each standard deviation was more specific to that particular period – not a universal average).
  4. Hedonic adjustments attempt to remove price changes due to the changing quality of the underlying goods. You can read more about hedonic adjustments here.
  5. Drawdown is defined as the maximum percentage fall a portfolio has experienced over a particular period.

Dividends Are Different

Here is a link to the pdf: Dividends Are Different.
OVERVIEW

There has been abundant discussion regarding the utility of dividends. Many investment models rely on factors or other strategies in their attempt to increase returns or reduce volatility. These approaches generally focus on total returns and brush dividends under the rug. Some go further and argue specifically against dividends – occasionally likening dividend advocates to sacred cow worshippers. The low dividend yields and strong capital appreciation we have observed in recent years has probably diminished the reputation of dividends as well. On balance, we find the art and science of dividends has largely been forsaken.

This is a pro-dividend article. While we acknowledge some issues with dividends (e.g., inefficiencies in how they return capital to shareholders), we find many investors and practitioners do not fully understand or appreciate some of the key attributes that can make dividends useful – especially in the context of retirement income.

This article discusses some pros and cons of dividends. We also weigh in on previously-discussed issues and share what we believe are some new perspectives. Some of claims we revisit/challenge are:

  • Synthetic dividends are the same as real dividends
  • Dividends are equivalent to buybacks when returning capital to shareholders
  • Dividends comprise the bulk of total returns investors experience

As the title suggests, the primary goal of this article is to explain what makes dividends different. We believe it is important to acknowledge the intrinsic fundamental nature of dividends. In particular, this creates a unique value proposition in that dividends can provide investors with a growing stream of income that is largely independent of market volatility.

On balance, we believe dividends are a powerful financial planning tool many retirement models seem to neglect. Please stay tuned for our future article(s) were we will present a retirement income strategy that leverages some of the benefits discussed in this article.

Figure 1: Achieving the same result via different actions

Figure 1: Achieving the same result via different actions Figure 1: Achieving the same result via different actions

Source: Aaron Brask Capital

Content summary

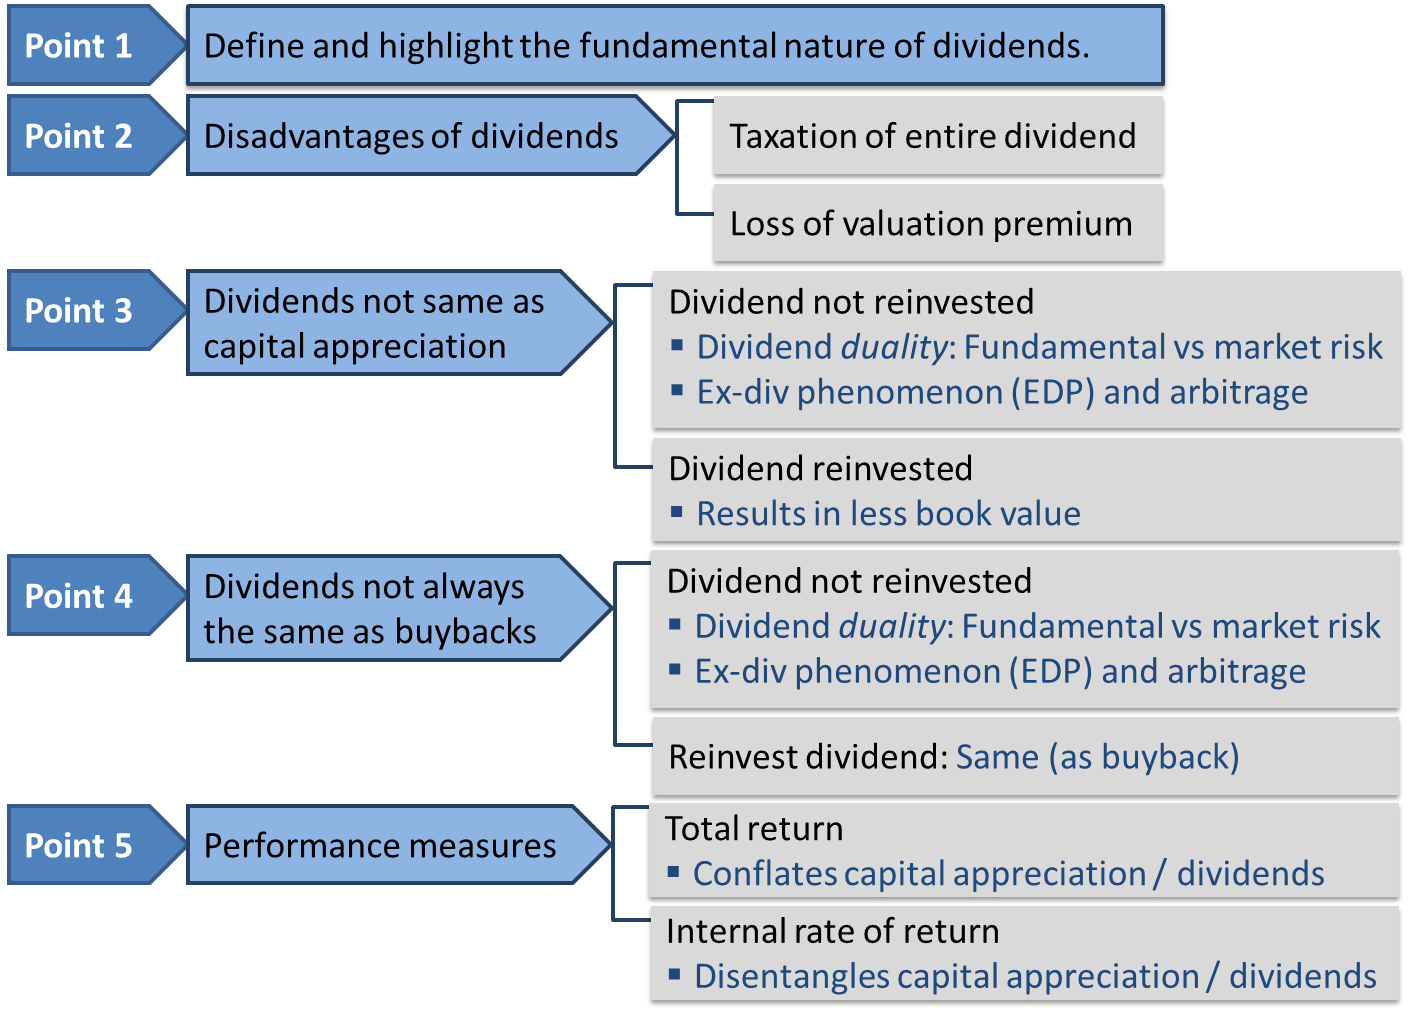
We first explain what a dividend is and highlight its fundamental (as opposed to market-based) nature – a critical notion that resonates throughout the rest of the article. We then discuss two key issues regarding how dividends may be an inefficient means of returning capital to shareholders. The following two sections challenge popular claims regarding dividends and how they are related to market returns and buybacks. The penultimate section (before our concluding remarks) discusses the relevance of calculating performance via total returns versus internal rates of return in different contexts and shares related empirical observations.

Figure 2: Executive summary

Figure 2: Executive summary

Source: Aaron Brask Capital

What is a dividend?

A dividend is a direct cash[1] payment from a company to its shareholders. Of course, if you hold stocks and/or stock funds at a broker or custodian (e.g., Charles Schwab), then they will simply facilitate that payment by transferring the funds from the issuer to your account. In many cases, they will take your dividend and reinvest it by purchasing more shares of the stock via an automated DRIP (dividend reinvestment plan). A key point here is that dividends are paid directly from the operating business to shareholders. So they depend on the fundamental performance of the business and effectively bypass stock market volatility[2].

Figure 3: Dividends bypass market volatility

Figure 3: Dividends bypass market volatility

Source: Aaron Brask Capital

Of course, economic cycles and stock markets are related. For example, market collapses often occur around the same time as recessions. During these periods, the overall market’s fundamental performance (e.g., earnings) can slow or turn negative and result in dividends cuts. Based on these observations, some may be tempted to equate dividend risk and market volatility. However, this logic is not sound.

If we control for cyclical versus non-cyclical businesses (without a look-ahead bias), then the linkages between fundamentals, market prices, and dividends becomes more clear. For example, our data shows that dividends of non-cyclical businesses were significantly more robust than those from cyclical businesses during the last recession (i.e., the credit crisis) and other turbulent periods. While markets may have thrown out the babies (share prices of non-cyclical business) with the bath water (share prices of cyclical businesses), the underlying fundamentals were real drivers of dividend performance. We will revisit this notion and provide more data in our next article.

Another way to recognize the fundamental versus market–based nature of dividends is to consider a private company paying a consistent stream of dividends to its shareholders. Based on the operating performance of the business and management’s decisions, those dividends are 100% fundamental in nature. There isn’t even a market price to consider since it is a private company. Now let us consider what happens if this company went public with an IPO[3] but continued its policy of paying dividends. The company’s shares would trade on an exchange, but such trading would not alter the fundamental nature of the dividend cash flows.

Note: Recognizing this fundamental versus market-based nature of dividends is important as many of the arguments we put forth in the rest of this article rely on it.

Dividend disadvantages

Before we address some common misconceptions regarding dividends, we first acknowledge two related disadvantages. Both of these factors highlight potential inefficiency in how dividends return capital to shareholders.

The first and most straightforward issue relates to taxes. The crux of the disadvantage is that dividends are typically taxed in their entirety. Even if we use the same tax rate (i.e., long-term capital gains rates for qualified dividends), only the capital gain component of stock sold (i.e., not the cost basis) is taxed – not the entire dollar amount of stock sold. In this sense, dividends impose additional tax friction relative to selling one’s holdings and this imposes a real cost.

Assuming a hypothetical (qualified) dividend yield of 2% and long-term capital gains tax rate of 20%, dividends would impose approximately 40 basis points (20% x 2%) of tax drag. If the stock were flat or down, then there would be no capital gains tax for selling shares to create a synthetic[4] dividend. Only holdings with extremely low cost basis (i.e., the position is mostly capital gain) would trigger a similar magnitude of taxes upon selling.

The other issue we highlight relates to valuation. Consider an investor who reinvests dividends in a company. The dividend represents a direct transfer of book value[5] from the balance sheet to the shareholder on a dollar for dollar basis (i.e., each dollar of dividend reduces the book value by one dollar[6]). However, when reinvesting the dividend, this investor will likely repurchase book value at a premium (i.e., the price to book ratio is typically greater than one). This is effectively buying high and selling low (albeit in the opposite order). Warren Buffett touched on this topic and shared an illustrative example in his 2012 annual letter. There are multiple assumptions and nuances embedded his analysis,[7] but the conclusion is straightforward: returning capital via dividends can negatively impact investors.

Returns from dividends are not the same as capital appreciation

Conventional wisdom amongst many academics and practitioners is that dividends are the same as capital appreciation for all intents and purposes.[8] They assume one should be indifferent to receiving dividends versus selling shares to generate the same level of income. We disagree. The following two subsections highlight and refute what we believe are the two most popular pieces of evidence (academic research and the ex-dividend phenomenon) used to argue for dividends’ equivalence to capital appreciation.

Popular research article(s)

Perhaps the most popular research articles commonly referenced in this context is a 1961 paper entitled Dividend Policy, Growth, and the Valuation of Shares by Merton H. Miller and Franco Modigliani (M&M). The article starts out by assuming “… an ideal economy characterized by perfect capital markets, rational behavior, and perfect certainty.” We find each of these assumptions rather unrealistic. So we are naturally skeptical of any conclusions based on all three. Notwithstanding, we will try to highlight where we believe their logic does not gel with the real world.

First, let us consider Buffett’s 2012 annual letter highlighted above where he unambiguously argues dividend policy does matter for investors. Taking Buffett’s words for gospel, we might be tempted to stop there. However, it is more informative to reconcile these two theories and get to the heart of the matter. We break this challenge down into two scenarios: one where the dividend is spent and the other where it is reinvested.

In the case where a dividend is kept or spent (i.e., not reinvested), this income comes directly from the company and is thus fundamental in nature – not impacted by the daily noise in the market. However, if one were to create a synthetic dividend via selling stock, the price of the stock would matter. For example, any market noise on that day (e.g., a Trump tweet) could change the price and hence the number of shares one would need to sell, but would not alter a dividend payment. The essence of risk is different (fundamental vs market-based) and we believe this differentiates real dividends from synthetically generated dividends and capital appreciation, both of which are clearly impacted by market noise.

The potentially more interesting case to consider is when a dividend is reinvested. The discussion and calculation of stock returns[9] in the M&M paper indicates there is an embedded assumption the money would not be spent but remain (re)invested. A fair question to ask is: What if the market prices were different that day? Then the investor would purchase either more or fewer shares with that dividend. Moreover, they would still generally end up owning less book value than if the dividend were not paid. This is due to the transition of each dollar of dividends from the balance sheet to the shareholder. As highlighted above, the market typically values each dollar on the balance sheet at a premium (i.e., the price to book value is usually greater than one). However, once it is passed on to shareholders, it is just a dollar. So when each dollar of dividend is reinvested, it purchases less than one dollar of book value.

The net result is the shareholder owning less book value. If that dollar were left on the balance sheet and put to productive use within the company (even if the marginal rate of ROA or ROE was slightly lower), it would still be valued at a premium. So the payment of a dividend (versus no dividend) clearly has an impact on what shareholders own and thus pokes a hole in the M&M paper’s conclusions.

Concept: Dividend duality

In our view, dividends represent a unique phenomenon in that they straddle (pierce) the veil between corporate fundamentals and markets prices.[10] The M&M paper ignores this subtle but interesting dichotomy. We are by no means saying this was an intentional omission; it is simply a byproduct of their framework that does not look below the surface of market prices to consider fundamental performance or valuation. Instead, their starting point was efficient markets. So their assumptions did not allow for the possibility of such an inconsistency (i.e., dollars inside the company may be valued more than dollars outside).

Of course, it is not surprising there is some discrepancy on the matter since M&M’s assumptions regarding market efficiency are at odds with Buffett’s take on markets and picking stocks. Indeed, one might say our view on fundamentals and markets represents a bottom-up perspective. We believe there are fundamentals and that prices generally follow them over the long run. However, the M&M paper takes a top-down perspective. They effectively assume the market is right and reverse engineer conclusions from there.

We suspect this fundamental versus market duality of dividends is not compatible with many of the market models and assumptions used in academia and practice. In their white paper entitled The Dividend Disconnect, Samuel M. Hartzmark and David H. Solomon (H&S) identify and discuss behavioral patterns related to dividends that many investors exhibit. Their paper starts with a quote (from James MacKintosh of the Wall Street Journal) that glorifies dividends as being the rightful “arbiter of stock-market value.” Then they highlight the irrelevance of dividends (versus, say, synthetic dividends or capital appreciation) based on the M&M paper. This concept provides the basis for their analysis whereby they make interesting observations regarding investors’ behaviors around dividends that are seemingly irrational given the assumption of dividend irrelevance. They even go as far as to put forth the notion of the free dividend fallacy whereby some investors may view dividends as being free and not impacting the corresponding stock prices.

We find ourselves somewhere in the middle. On one hand, we do not believe dividends are free or that they are the ultimate rightful “arbiter of stock-market value.” On the other hand, we do not find them irrelevant either. Given our healthy respect for dividends and their fundamental/market duality, we find the observations from the H&S paper unsurprising. We suspect many of their conclusions are the result of widely varying utility functions digesting this duality differently. For example, savers in the accumulation phase and retirees focused on income may perceive and value dividends very differently. It may simply be the case that dividend-paying stocks should be analyzed in a different manner than companies that do not pay dividends. Accordingly, many existing market models may need refinement to better accommodate this concept of dividend duality.

Geek’s note

Here we mathematically interpret and reconcile the assumptions behind the M&M paper and those described in Buffett’s 2012 annual letter. First their respective formulas for stock returns:

ρMM (t)=(p(t+1)+d(t))/p(t) -1

Miller/Modigliani: where ρ represents the return over period t, is the price at time t, and is the dividend paid at time t.

ρWB (t)=(p(t)×(1+ROE)-(MTB-1)×d(t))/p(t) -1

Warren Buffett: where is the assumed return on equity and is the assumed market to book ratio (a.k.a. price to book).

The first formula is a taken directly from the M&M paper with minor algebraic manipulation. The second formula is our translation of Buffett’s framework from the 2012 annual letter. The real world of fundamentals and markets naturally do not conform to either of these rigid models, but we believe the formulas can help us illustrate a couple points.

First, the numerator of the fraction describing Buffett’s return grows book value by the ROE, but then subtracts a second term. That second term effectively represents a penalty for dividends. On the balance sheet, those dollars of equity are valued at a premium (MTB), but they are regular dollars when passed shareholders. Note: In the absence of dividends, the return on the stock is the same as the ROE in his framework – an observation we find sensible.

Second, the M&M formula for return involves no fundamental factors. In fact, the returns are exogenously defined so that they are equal for all stocks. So the formula does not represent a function whereby independent variables are combined to calculate a dependent variable (as is the case with the formula based on Buffett’s framework). Instead, the variables on the right side of the equal sign are effectively there to conform to the return on the left side. This effectively highlights the mathematical distinction between the top-down M&M model and Buffett’s bottom-up framework.

The ex-dividend phenomenon (EDP)

The ex-dividend phenomenon (EDP) describes the pattern whereby stock prices tend to decline by the amount of their dividends once they trade ex-dividend. There is much research supporting this hypothesis and our findings corroborate it as well. However, there are many who cite the EDP as empirical evidence or conclusive proof of the equivalence between dividends and market prices. This is where we disagree. To be sure, we would not be convinced even if ex-dividend price declines perfectly reflected the dividend amounts in every instance.

According to Buffett’s example and our concept of dividend duality, it may be the case that some value is destroyed at the instant when cash for dividends leaves the balance sheet and goes to shareholders. I have not seen or heard of any such models, but it is possible markets decompose stock values into their future reinvested earnings and their dividend stream. These models could even discount the price to reflect the value destruction highlighted above. So dividends would effectively accrue,[11] but they would be valued separately from other book value on the balance sheet.

Under these contrived market model assumptions, dividend duality would no longer be a concern as the balance sheet cash earmarked for dividends would be accounted for separately and could thus make a more seamless transition from the balance sheet to the shareholder – thereby making this efficient market framework perfectly compatible with the EDP.

We simply do not believe markets systematically value stocks this way. Markets are made up of many investors with different utility functions[12] and much market volatility is just noise. In fact, daily stock price volatility is on a similar order of magnitude as ex-dividend adjustments.[13] So we find it presumptuous, if not naïve, to assume markets operate this way when stock price volatility can mask the real mechanics of fundamentals and valuations.

Why is the EDP so prevalent?

The discussion above does not disprove the logic whereby some use the EDP as evidence that dividends and capital appreciation (or synthetic dividends) are equivalent. It merely pokes holes in one theory (our contrived market model) that would be sufficient to equate the two. To call this equivalence further into question, we highlight another theory that could explain the EDP, but still allows for the possibility of dividends being different.

Let us now consider the derivatives market. Unlike cash markets where the activity of buyers and sellers sets prices, most derivatives are priced by arbitrage. That is, their prices do not necessarily reflect traders’ expectations of how those derivatives will perform. Instead, their prices are determined by how much it costs to hedge the derivative risk.

A forward or future contract might serve as a good example. Think of a hypothetical stock XYZ with a current price of $100. The price of a future whereby the stock would be delivered one year from today has nothing to do with futures traders’ expectations for this stock. Instead, they think of the cost of delivering that stock to their counterparty with as little risk as possible. In this case, they borrow $100 at, say, 5% and purchase the stock. They plan to sit on it for a year and then deliver it to the other party. Knowing they will have to repay $105[14] to their creditor, they set the price of the future contract accordingly. Any other price (higher or lower) would leave an arbitrage opportunity on the table.

The key point here is that the derivative price is set by arbitrage assumptions – not market expectations. This introduces another duality; one could have a view on the price of a derivative that differs from the arbitrage price. For a futures contract, this discrepancy is less interesting since a view on the futures contract would effectively just be a view on the underlying. However, it can get more interesting with options or more complex derivative products. For example, Berkshire Hathaway sold some derivatives (basically insurance or put options on equity indices) where the arbitrage-determined prices were higher than their expectations.

The EDP may simply reflect arbitrage. If stocks did not adjust by the amount of the dividend, then there might be an arbitrage. Strictly speaking, the EDP would fall into the category of statistical arbitrage since prices could move overnight based on other factors – noise or real news. Even so, arbitrage theory represents a very plausible (likely in our view) explanation for the EDP.

As Figure 1 indicates (see this link for a more humorous example of confusing cause and correlation), it is not always obvious what the true driver of a particular result is when observing an event. In this case, the ex-dividend price drop clearly reflects the amount of the dividend to some extent. However, we believe it is a mistake to interpret this observation with too much precision. Given the nuances of dividend duality, magnitude of market noise, and the existence of arbitrage as an alternative explanation for the EDP, we find it presumptuous to conclude that dividends and synthetic dividends are equivalent.

Dividends are not always equivalent to buybacks

Let us first state that we agree that dividends are equivalent to buybacks when the dividends are reinvested. In this case, one ends up owning the same amount of book value as they would have had there been no dividend. Of course, taxes and the price one reinvests at[15] may alter things to some degree. However, the key element here is that both scenarios involve the purchase of book value at the same premium. This was not the case when we compared a reinvested dividend to a non-dividend payer.[16]

In the case where dividends are not reinvested in the same stock, dividends are not equivalent to buybacks. This follows from the distinction we made earlier regarding how income is generated. In the case dividends, investors receive a direct stream of cash flows directly from the companies, which makes any market volatility or noise irrelevant. In the case of buybacks, one will be at the mercy of the market when they go to sell shares to create their synthetic dividend. This market dependence makes buybacks intrinsically different than dividends.

Performance measures: Conflating the notions of dividends and capital appreciation

So far, much of this article has focused on understanding dividends and how they are different than capital appreciation. We made the distinction between whether dividends would be reinvested or not to clarify some of our arguments. We now highlight what we believe to be a better way to account for dividends in the context of retirees and other situations where dividends are spent and not reinvested.

For example, those in the accumulation phase (i.e., savers) may be more likely to reinvest dividends whereas those in the decumulation phase (i.e., retirees) might not be. This raises an interesting question regarding market performance calculations. In particular, is the total return (TR) or internal rate of return (IRR) calculation more appropriate?

Perhaps we are ignorant of the literature on the topic and we did not try hard enough to find relevant material, but we did not come across a paper or article that accurately reflected our perspective on the relevance of TR versus IRR for different investment purposes (i.e., saving versus retirement income).[17] Given our view that dividends are different (than, say, capital appreciation), we are naturally cautious about calculations that mix the two together.

The total return calculation conflates the notions of dividends and capital appreciation. When dividends are reinvested, they effectively ride on the back of future capital appreciation. So if one uses TR metrics, the information regarding the contribution from dividends is lost. In other words, you can use capital appreciation and dividends to calculate TR, but you cannot back out capital appreciation or dividend information from TR data.

This is why we believe IRR metrics can be useful – especially in the context where investment income will be spent rather than reinvested. IRR allows one to easily disentangle dividends from capital appreciation. Indeed, you start with an initial investment in a stock (or other asset). Then for any given period, you will have a stream of dividends and the terminal value of the stock at the end. You can calculate the IRR of the capital appreciation alone and then you can calculate the IRR with the dividends.

One might argue you could make similar calculations with and without dividends via TR. However, the key distinction here is that TR calculations depend on the trajectory of the share price – not just the terminal value. The IRR is not impacted if prices go up then down, down then up, or monotonically inch toward their final destination.

To be sure, TR calculations are convenient to use and are stored in thousands of databases. Virtually all academics and practitioners utilize TR for measuring stock performance. We suspect the bifurcation of the investment services industry between security selection and asset allocation[18] reinforces this trend. Indeed, investment advisors typically sift through the universe of funds and other investments based on TRs (and other technical measures like volatility, correlations, etc.) and build portfolios and asset allocations accordingly. So they effectively ignore dividends and that suits their needs.

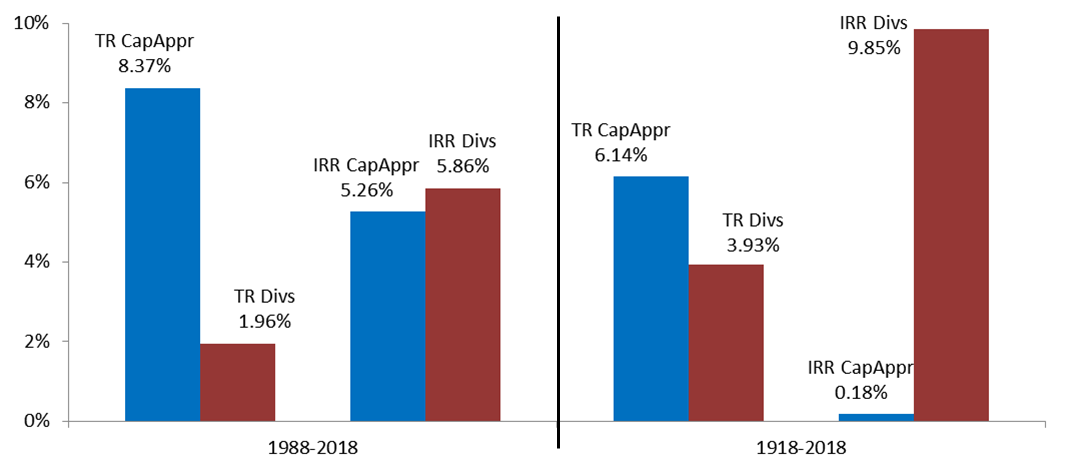
As the British statistician George E.P. Box wrote, “All models are wrong but some are useful.” It is fine if dividends do not play a role in everyone’s models. However, we like to acknowledge the fundamental nature of dividends and the potential utility they can provide, especially in the context of retirement income. So we finish this section with some comparisons of the IRR and TR calculations. The first scenario is hypothetical and assumes share prices and dividends grow at a rate of 5%. The second scenario is based on S&P 500 data index over the last century (1918-2018). We think of this second scenario as a real-world sanity check for the results in our hypothetical scenario.

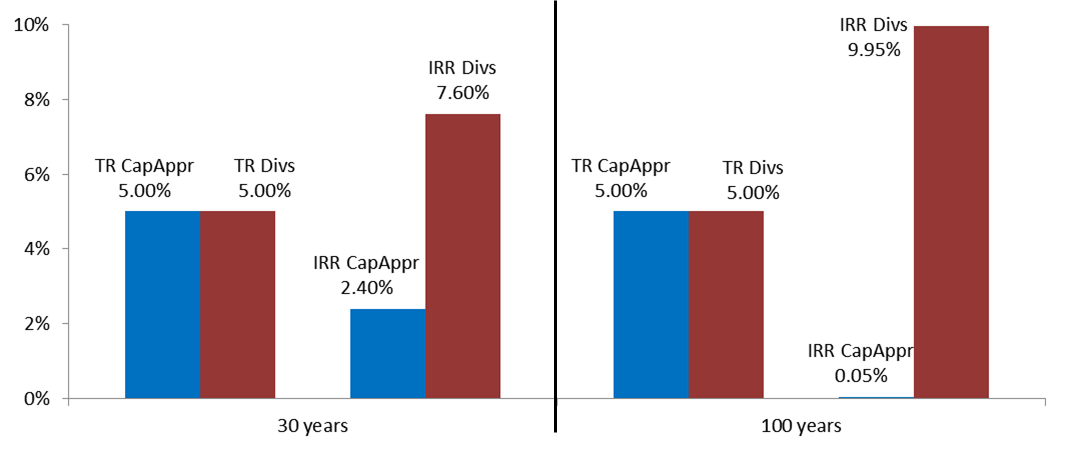
In a world where share prices and dividends grow by precisely 5% each year, the TR and IRR over every period is 10%. This is simply by construction. What is interesting is the difference between the dividend contributions as measured by TR vs IRR. Let us consider a 30-year period (not atypical for a retirement time horizon). The TR excluding dividends is 5% – again by construction. So that means dividends contributed 5% or half of the TR. However, the dividend contribution when measured by IRR was 7.6%. So the capital appreciation contributed just 2.4% when measured by IRR. If we extended the time period to 100 years, then the dividends claim an even larger share of the contribution – 9.95% of the total 10% return – when measured by IRR.

Figure 4: Dividend contribution depends on context (hypothetical portfolio)

Figure 4: Dividend contribution depends on context (hypothetical portfolio)

Source: Aaron Brask Capital (Robert Shiller’s online data)

Of course, the above scenario is contrived and the real world does not follow formulaic conventions. So let us look at the second scenario using real data. Over the last 30 years (1988-2018), the S&P 500 TR was approximately[19] 10.3% and dividends contributed 2.0% of this. During the same period, we calculated the IRR to be 11.1% with dividends contributing 5.9%.

Over the last 100 years (1918-2018), the S&P 500 TR was approximately 10.1% and dividends contributed 3.9% of this. During the same period, we calculated the IRR to be 10.0% with dividends contributing 9.8%.

Figure 5: Dividend contribution depends on context (S&P 500)

Figure 5: Dividend contribution depends on context (S&P 500)

Source: Aaron Brask Capital (Robert Shiller’s online data)

Of course, much of what we see in these results is just the mathematics of the starting dividend yield and subsequent growth (both dividends and capital appreciation). However, it should be evident that the contribution of dividends is relative – to both the context of the investor and the time frame. This is an important consideration when you come across claims regarding the importance of dividends or how much they contribute to overall market returns. Moreover, this analysis highlights the utility of the IRR metric when one wishes to truly isolate contributions from dividend versus capital appreciation.

Concluding remarks

Why did we write this article? Some might say we just like to quibble over pointless semantics. That is certainly not the case here (though the author is guilty of this sometimes). We are preparing the groundwork for future articles where we will articulate what we believe is a new and innovative retirement income strategy. Dividends are an essential component of this approach, but we simply prefer not to dilute that discussion.

This article addresses some misconceptions and mischaracterizations related to dividends. Some of these are likely the result of what we dub dividend duality. Indeed, dividends’ unique ability to straddle and pierce the corporate veil represents an anomaly that many market models may not be able to properly digest.

We may have beaten this horse to death, but the primary point of this article is to show that dividends are different. In some ways, this is negative (e.g., taxes and loss of valuation premium). In other ways, this can be positive. Given that dividends are direct transfers of assets (typically cash) from companies to shareholders, they can provide growing streams of income that are largely independent of market volatility.

It is important to understand there are different perspectives at play here. There is the decision by each company to pay a dividend (and/or buyback stock) or not. As the CEO of Berkshire Hathaway, Warren Buffett clearly prefers not to pay dividends. We understand his reasoning and do not disagree with his logic.

As investors, however, we are selecting stocks. Some pay dividends and some do not. Even those who are most critical of dividends seem to agree it is not sensible to let the dividend tail wag the dog. That is, dividends may have their disadvantages, but they are not so bad as to avoid them altogether.

Many credible approaches to investing and retirement income (e.g., factor models) still invest in dividend-paying stocks. Some even have higher dividend yields[20] and thus suffer more from the disadvantages we highlighted earlier. So these investment managers are clearly not avoiding dividends payers. We suspect they simply do not want to constrain their opportunity set (i.e., the universe they draw from) as it could have unintended consequences and potentially detract from performance (e.g., bias toward growth stocks which could underperform or be more volatile).

As a parting summary to help avoid ambiguity, here we layout several items we are and are not claiming:

What we are claiming:

  • Dividends are direct transfers of cash from companies to shareholders and effectively bypass market volatility.
  • Dividends are not always equivalent to capital appreciation or buybacks.
  • Dividend duality makes dividends less compatible with many existing market models.
What we are not claiming:

  • Dividend-paying stocks are better than non-dividend-paying stocks.
  • Dividends are free.
  • Dividends are the ultimate ‘arbiter of stock-market value’ (comment from James MacKintosh via the Wall Street Journal).

Disclaimer

  • This document is provided for informational purposes only.
  • We are not endorsing or recommending the purchase or sales of any security.
  • We have done our best to present statements of fact and obtain data from reliable sources, but we cannot guarantee the accuracy of any such information.
  • Our views and the data they are based on are subject to change at any time.
  • Investing involves risks and can result in permanent loss of capital.
  • Past performance is not necessarily indicative of future results.
  • We strongly suggest consulting an investment advisor before purchasing any security or investment.
  • Investments can trigger taxes. Investors should weight tax considerations and seek the advice of a tax professional.
  • Our research and analysis may only be quoted or redistributed under specific conditions:
    • Aaron Brask Capital has been consulted and granted express permission to do so (written or email).
    • Credit is given to Aaron Brask Capital as the source.
    • Content must be taken in its intended context and may not be modified to an extent that could possibly cause ambiguity of any of our analysis or conclusions.
  1. Technically, dividends may take the form of shares of cash, stock, or other property.
  2. It is possible for market conditions to impact dividend payout decisions. For example, corporate executives may see better opportunities (e.g., buybacks or acquisitions) or may be influenced by a ‘keeping up with the Joneses’ mindset relative to their competitors’ dividend policies. Moreover, buybacks impact future dividends by reducing shares outstanding. So lower or higher market prices could affect the number of shares repurchased and the amount of dividends paid on a per share basis.
  3. IPO = Initial public offering. This is the process by which a company can sell some of its equity to the public – after which it will have shares trading on a stock exchange.
  4. A synthetic (or homemade) dividend is a cash flow generated by selling some of one’s shares.
  5. Technically, dividend actually come out of the assets and retained earnings, but the result is a reduction in book value.
  6. This assumes no buybacks are taking place at the same time.
  7. In his example, Buffett relies on book value as a core fundamental metric and uses the price-to-book ratio for valuation (instead of, say, earnings and the price-to-earnings ratio). He also uses return on equity instead of return on assets or other variables. Some may question or alter these specific assumptions (even Buffett himself has questioned the validity of using book value), but we believe the thrust of the argument will still hold.
  8. Of course, taxes and transaction costs can be relevant.
  9. They calculate total returns. We discuss this performance calculation (and internal rates of return) later in the article.
  10. The wave-particle duality of light comes to mind – even if not a perfect analogy.
  11. Technically, the type of accruing we are referring to is not the same as with bonds where the seller of a bond retains accrued interest. In our scenario with dividends, the accrued dividend goes to the buyer. However, the share price might be valued lower to reflect the idle cash earmarked for the dividend.
  12. For example, there is much research showing how ex-dividend price trends are impacted by investors with different tax situations. Whether it is stocks, bonds, cash, bread, or butter, we all have different utility functions and this results in the transactions that make up our markets and economies.
  13. If a stock has an annualized volatility of 16%, then the volatility is approximately 1% on a daily basis. Given that dividend yields are around 2% and dividends are often paid quarterly, the ex-dividend adjustments are on the order on 0.5%.
  14. We assume no dividends are to be paid over this period.
  15. There could be a lag between when the stock trades ex-dividend and when investors can reinvest the proceeds (next morning).
  16. Recall that a dividend is transferred from the balance sheet to the investor dollar for dollar, but then purchases less book value of the company when reinvested, since stocks typically trade at a premium to book value.
  17. While they did not mention the investment context, one article we came across did at least highlight how total returns conflated the notions of dividends and capital appreciation.
  18. By security selection, we are referring to the activity conducted by funds and portfolio managers that buy and sell individual securities on a regular basis. These are people investors do not generally meet. Asset allocation is usually done by investment advisors or other financial professionals who deal directly with investors and help them sift through funds and other investments.
  19. This is only approximate because we are using Robert Shiller’s online data and had to make some assumptions regarding the timing and reinvestment of dividends.
  20. DFA’s flagship U.S. Large Cap Value Portfolio fund sports a dividend yield higher than that of the S&P 500 index (though lower than the S&P 500 value index). The point is that dividends may be ignored, but are not avoided.