AAII 2021 Virtual Conference Presentation

I was honored to speak alongside some industry heavyweights at AAII’s 2021 virtual conference. My topic was Using Income Annuities in Retirement. Here is a link to my (hour long!) presentation: https://lnkd.in/ehxXxScQ

Note: For those who are interested, I provided a link to the conference in the YouTube video description.

Readers interested in this topic may also want to read my other articles on annuities and income:

Bond Ladders & Income Annuities: Restoring the Sanctity of Fixed Income

Here is a link to the full article: Bond Ladders & Income Annuities

I spent some time on Google, but could not ascertain the origins of the term fixed income. Presumably, it was just a simple description given to investments where all of the related cash flows were dictated per contractual obligation. For example, this could be something as simple as a government bond that pays fixed coupons and returns the principal at maturity. However, the term fixed income has now come to describe pretty much any investment obligated to pay a pre-specified stream of cash flows – some of which are more complex (e.g., mortgage-backed securities).

Brushing some details under the rug (e.g., some bonds can be called), fixed income investments effectively allow investors to purchase future cash flows with a high degree of certainty.[1] However, it is important to note this degree of certainty only applies when the investments are held to maturity.

If an investment is sold before it matures, the sales proceeds will naturally be at the mercy of the market. Other investors will take into account the remainder of the cash flows to be paid and discount them via relevant interest rates. Thus, in the case where fixed income investments are not held to maturity, much of the certainty can be lost.

Without doubt, the high turnover of many bond funds can naturally destroy this essence of fixed income. Moreover, advocates of total return investing also seem to disregard the inherent stability of contractual cash flows as they put portfolio income right back into the market even when the ultimate goal is income.

This article attempts to restore this sanctity of fixed income. In particular, I advocate for the design and utilization of fixed cash flows in the context of asset-liability management (ALM) – thereby mitigating, if not avoiding, market volatility. While relevant to other investment mandates (e.g., private foundations with cash flow liabilities), I discuss this notion in the context of retirement income.

I use bond ladders and income annuities to highlight some potential benefits of this approach. In addition to potential cost and tax savings, the math behind this approach (i.e., time value of money) is much simpler than many of the statistical models used for portfolio management. Accordingly, I believe this approach can facilitate greater understanding and peace of mind for many investors. Retirement income is one natural application for this strategy. However, it can also be helpful in estate planning for blended families and other situations where one wishes to manage multiple beneficiaries’ claims to income and principal.

Note: Readers interested in this topic may also like to read an earlier article I wrote (Destroying Stable Income Streams) that focuses on a similar topic, but primarily in the context of dividends.

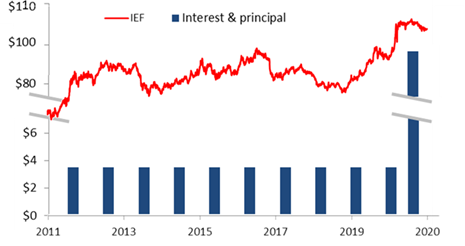
Figure 1: 10-year bond cash flows vs IEF price[2]

Source: Aaron Brask Capital

Figure 2: Dividend cash flows vs market price (VIG)
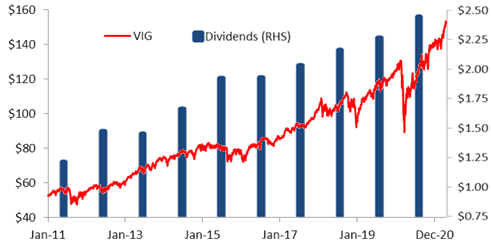
Source: Aaron Brask Capital

Background

Note: This article focuses on the context of retirement income, but it is worth noting the ideas are also relevant to other investment applications where one is tasked with addressing liabilities in the form of future outgoing cash flows (e.g., pensions, endowments, private foundations, etc.).

When it comes to investment strategies for retirement (and almost any other application), most individual and professional practitioners have adopted an approach based on total return investing and modern portfolio theory (MPT). So the natural income from the portfolio (e.g., dividends and interest) is typically reinvested and income required for spending is chiseled off from the portfolio as needed.

Portfolio volatility presents a risk as it can jeopardize one’s financial security in retirement by increasing the probability of running out of money (i.e., potentially less money to chisel from). For example, retirees may still need to withdraw from their portfolios during market declines and this would result in forced selling at depressed prices. Of course, conservative financial planning should allow for such situations and be able to withstand such scenarios.

This typically results in constructing a diversified portfolio that will offer an attractive balance of growth potential and risk. If we confine ourselves to a world with just stocks and bonds (for the sake of simplicity), then the idea would be for stocks to generate sufficient long term growth to help combat inflation or generate real returns[3] while bonds might be regarded as a diversifying asset. As long as the bond allocation keeps up with inflation and tends to zig when stocks zag, many investors are content to maintain significant bond allocations in order to balance risk in their portfolios.

Side note: Why do bonds typically exhibit lower returns and less volatility than stocks?

On the one hand, stocks are effectively perpetual securities and their dividends are not guaranteed. On the other hand, bonds ultimately mature and offer contractually guaranteed cash flows. Put simply, bonds offer more certainty than stocks. Thus, it is unsurprising stock prices tend to be more volatile than bond prices and investors label bonds as the safer investment.

Investment theory indicates higher returns are the reward for higher risk – assuming that risk is systemic and cannot be diversified away. In the US, this has certainly been the case historically with stocks handily outperforming bonds over the long run. So conventional wisdom holds that stocks should have higher expected returns than bonds over longer periods since they are more volatile.

This risk-based argument is presented from the investor’s perspective. What is less discussed is the flipside: the issuer perspective. That is, what about the perspective of the corporate or government issuers of securities? Let us take a corporation seeking to raise capital as an example. From their vantage point, issuing equity can be attractive in the sense that it does not impose any contractual payments (dividends, if any, can be skipped). However, if they issue a bond, then they will be obligated to make interest payments and repay the principal at maturity.

In this light, issuing equity imposes less financial constraint and may be viewed as a favorable option. Accordingly, they may be encouraged to issue equity rather than bonds. In turn, this could tip the scales of supply in demand in such a way to make stocks cheaper and more conducive to higher returns.

The bottom line is that market risk is critical in the context of retirement planning. So the lower volatility and low to negative correlations with stocks can make bonds useful in maintaining a diversified portfolio. However, viewing bonds only through the lens of market prices ignores the inherent stability they can provide in terms of generating specific cash flows with little to no uncertainty[4] (i.e., the same attribute that likely makes them less volatile).

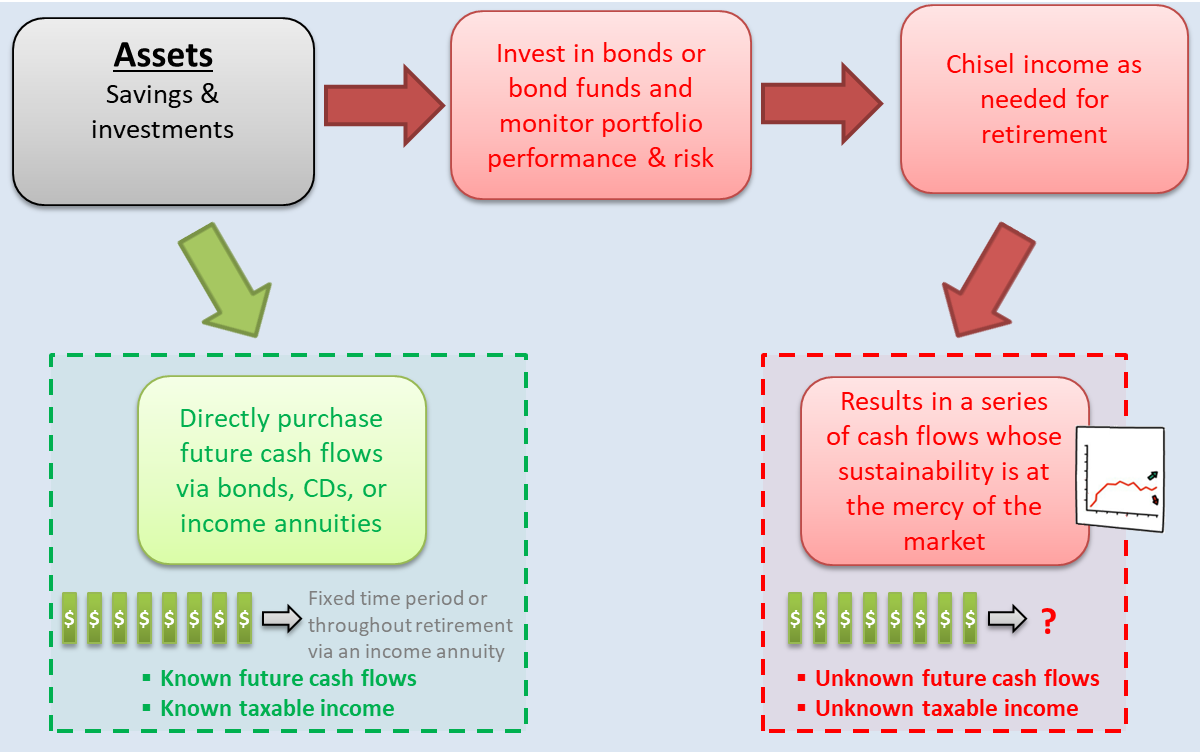
Let us take a step back and look at the bigger picture. Consider a retiree who wants to ensure their portfolio will provide adequate income as long as they may live. A portion of this income will likely come from their fixed income allocation. So they purchase bonds or bond funds, but only to observe them as squiggly lines on charts that may later be converted to cash. In other words, they purchase future streams of cash that could be used for retirement spending, but ignore those stable cash flows, reinvest them, and end up at the mercy of the market when they want to extract those funds down the road.

Figure 3: Roundabout way to create future cash flows

Figure 3: Roundabout way to create future cash flows

Source: Aaron Brask Capital

This seems a rather roundabout way of using bonds when the ultimate goal is income. Bonds and, more generally, fixed income investments already generate specific cash flows that are independent market risk when held to maturity. In my view, this is the real sanctity of fixed income investing. However, this notion seems to have been lost with many of the contemporary investment strategies that do not specifically align assets with liabilities comprised of future outgoing cash flows.

While the term fixed income is still widely used to describe various investments, it has lost the essence of its literal meaning. Hence this article and my goal to restore this sanctity of fixed income. The following sections discuss two specific tools investors can use to generate fixed cash flows and manage relevant risks: bond ladders and income annuities. While I touch on some of the potential cost and tax savings, I believe the greatest benefit is simplicity. In my experience working with many investors over the years, I find a greater understanding of one’s financial plan often facilitates the most peace of mind – regardless of the potential monetary benefits.

Bond ladders

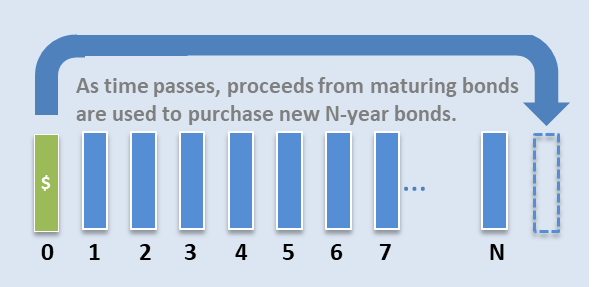
A bond ladder is basically a series of bonds spaced out over a specified time period (e.g., five, 10, or 20 years) and held to maturity. As time passes, each bond’s time to maturity decreases. In particular, the proceeds from each maturing bond are used to purchase a longer term bond to restore the original length of the ladder.

Figure 4: N-year bond ladder illustration

Figure 4: N-year bond ladder illustration

Source: Aaron Brask Capital

For example, let us consider a 10-year bond ladder comprised of 10 bonds – one for each year. After one year passes, the first one-year bond matures and the 10-year bond is now a nine-year bond. So the proceeds from the maturing bond are used to purchase another 10-year bond and we are back to a 10-year bond ladder again.

I may have brushed some of the details under the rug (e.g., callable bonds and defaults), but this describes the general approach. The process is simple and eliminates unnecessary turnover from any jockeying around. There are basically two moving parts: how long of a time period to use and how far to space bond maturities within the ladder. So let us consider what to consider when deciding how to structure a bond ladder.

I find the main decision is how long to structure a ladder. Several factors are relevant here. In an environment with a typical upward sloping yield curve, longer ladders will naturally increase the yield. At the same time, this will also likely increase the volatility of the ladder’s market value and vulnerability to inflation. While many people consider volatility synonymous with risk, this could actually improve a ladder’s ability to diversify other positions (e.g., allocations to stocks).

Shorter bond ladders basically exhibit the opposite attributes. They generally have lower yields, are less volatile, and less susceptible to inflation. Indeed, as each year passes, shorter ladders would reinvest a larger proportion of their total capital (1 out of N bonds) and more quickly benefit from the presumably higher rates.

Figure 5: Bond ladder attributes

Figure 5: Bond ladder attributesWe could take this example to the extreme by considering a bond ladder with zero length. That is, the capital would simply be invested at overnight rates (like a savings account). On the one hand, it would not earn any term premium.[5] On the other hand, it could instantly benefit from any higher rates due to inflation. This train of thought could be useful for retirees where inflation is a critical risk.Source: Aaron Brask Capital

Of course, one could use different types of bond funds (long- vs short-term) to manage the above risks. However, I find the simplicity and passive nature of bond ladders attractive – especially when focusing on the income profile and its relationship with inflation. In my experience, both active and passive bond funds tend to have excessively high turnover. This jockeying around from one bond to another does not necessarily lead to any reliable benefits, but can impose additional fees and trigger sporadic capital gains.

Another application for bond ladders is one in which the actual bond principal is used for consumption. For example, consider a couple with one child entering college now and another starting four years down the road. In this case, they may wish to set aside funds to cover tuitions for the next, say, eight years. In this case, it is not just the bond income that is relevant as the principal will be spent as well. One might even use certificates of deposit (CDs) that accrue or fixed annuities,[6] but do not pay any interest.

Retirees may also set up bond ladders with the intention of spending the principal as bonds and CDs mature. The obvious challenge in this scenario is not knowing how long to they will live. If they build a bond ladder out to their (actuarial) life expectancy, then they may live longer than average and have no more bonds maturing to fund their retirement. One solution is to plan for a reasonably long lifespan. However, this requires one of two things:

  1. More money to provide for those potential additional years of spending or
  2. Reducing the amount invested in each bond or CD which means less money for spending each year

On an individual basis, each retiree may effectively be forced to plan for the ‘worst-case’ scenario – living longer. For the lucky few that live like cockroaches, they will be happy they planned conservatively. For the majority who live shorter, average, or slightly above average lifespans, this conservative approach will result in their retirements being overfunded (only known in hindsight). Accordingly, this approach results in significant overfunding at the aggregate level – a natural byproduct of each individual’s desire to avoid running out of money. The income annuity products in the next section directly address this issue.

Income annuities

Simply put, an income annuity is a product offered by insurance companies whereby they allow individuals (or couples) to purchase income that is guaranteed to last as long as they live (e.g., throughout retirement). The amount of income relative to the purchase price is determined by a combination of actuarial (i.e., life expectancy) and market factors (i.e., interest rates). As of my writing, for example, a 70 year old male can purchase $1,443 in guaranteed monthly income for the rest of his life for $250,000. On an annual basis, this represents a payout of approximately 7%.[7]

Side note: Annuities are bad, aren’t they?

Annuities have rightfully earned a negative stigma from the agents pushing more expensive products with higher commissions. While I have written extensively on the drawbacks of variable annuities (e.g., excessive fees and potential tax issues), I find income annuities to be a very efficient tool for retirement planning. Unlike their complicated variable cousins, income annuities are very simple. This simplicity makes it easier for insurance companies to manage their risk. In theory, this should help to reduce their costs. Moreover, simplicity also makes it much easier for investors and independent agents (like myself) to compare apples with apples, shop around, and get the best rate. This comparison shopping imposes additional gravity on income annuity prices from competition.

In my experience, income annuities have become more competitively priced in recent years and this makes them an attractive option for many retirees. I built my own calculator to assess the implied costs embedded in income annuities for my clients, but online calculators are also available for those who know what they are doing (one example here). David Blanchett (Morningstar Investment Management), Michael S. Finke (The American College), and Branislav Nikolic (York University – Department of Mathematics and Statistics) published a recent article that corroborates my experience. Indeed, when normalizing for interest rates, they find the trend for income annuity prices was lower over the seven-year period ending in August 2020. In another article, Blanchett and Finke found that the rates offered by some multi-year guaranteed annuities (MYGAs) were more attractive than those with CDs, government/treasury bonds, and corporate bonds.

Figure 6: Example income annuity illustration

Figure 6: Example income annuity illustration
As I highlighted in the previous section, individual investors generally cannot afford to run the risk of assuming they will only live to their actuarial life expectancy. Accordingly, they often play it safe by allocating enough money to fund retirement for a period that is significantly longer than their true life expectancy. So this results in overfunding at the aggregate level. This is where insurance companies can be helpful.Source: Aaron Brask Capital

Unlike market volatility, actuarial risks such as lifespans are very predictable when averaged across large groups of people. By pooling risks across many annuity customers, insurance companies can effectively net out the longevity risks and price guaranteed lifetime income based on the average life expectancy. For individuals who would otherwise have to plan well beyond their life expectancy to be safe, pooling risk via an income annuity could allow them to free up capital or purchase a higher level of income per year.

For example, consider a 65 year old man with a life expectancy of 18 years (i.e., expected to live to 83 years old) deciding between a bond ladder and an annuity. Assuming the same level of annual cash flows, constructing a bond ladder out to age 90 would cost significantly more than an annuity based off of a life expectancy of 83. Indeed, the bond ladder would require funding 25 years (90 – 65) of cash flows whereas the annuity price would only reflect the average of 18 years. Ignoring the time value of money, the bond ladder would require approximately 39% (25÷18-1) more capital for the same level of cash flows.

Figure 7 below illustrates the expected mortality rates for 65 year old males and females. As one might expect, very few people are expected to die early on, most will likely live to right around their actuarial life expectancy, and increasingly fewer will be expected to live each year further out. With a large enough group of income annuity purchasers, the shapes of these curves would directly reflect the actual outgoing cash flows. So an insurance company could purchase fixed income investments to provide for that cash flows.[8]

While insurance companies are in business to earn a profit, any additional expense (above and beyond the actuarial fair price) paid by income annuity purchases would likely be significantly less than what it would cost for them to secure their own income through age 90, 100, or beyond – whatever age required to ensure the likelihood of running out of money was de minimis. The market jargon used to describe this averaging phenomenon is mortality credits. That is, income annuity clients who live longer effectively receive credits from those who live shorter lifespans.

Figure 7: Distribution of mortality rates

Figure 7: Distribution of mortality rates

Source: Social Security Administration (2017 period life table)

Mortality credits alone can make income annuities an attractive tool for many retirees. However, I also like to present income annuities from another perspective. Given the current market environment where both interest rates and dividend yields are so low, most retirees will not be able to live off the natural income from their portfolios (i.e., dividends and interest). Accordingly, they will have to dip into principal to fund their retirement.

Once one acknowledges principal will be sold over the course of their retirement, they have a choice. One the one hand, they can wait and chisel as needed down the road. Of course, this leaves future income at the mercy of the market. Moreover, each time one chisels away from their portfolio, it will naturally reduce the dividend and/or interest income paid out in subsequent years. With less income, the shortfall could increase and require chiseling away even more principal. This can be a slippery slope.

On the other hand, one way to mitigate this risk could be to allocate a portion of one’s fixed income investments to a bond ladder or income annuity. Rather than being at the mercy of the bond market when chiseling off money for spending, an income annuity effectively allows one to pre-chisel income in advance – effectively eliminating the market risk for this stream of income.

Some other considerations with income annuities

In addition to fees (discussed in the shaded side note box above), another concern that periodically comes up is what would happen if one purchased an income annuity, but only ended up living a short period. If one paid a significant sum upfront for an income annuity, but only received a few payments in return, it would undoubtedly be negative economic outcome (and personal tragedy). However, most insurance companies will guarantee a 100% return of premium in exchange for reduction in payout. This is effectively a money-back guarantee – something most conservative bond funds cannot even offer. Given the low interest rate environment we are currently in, I find this option provides additional peace of mind – especially where children or other legacy concerns are present.

One approach many people choose is to allocate just enough to an income annuity to cover their basic necessities. More generally, I like to integrate income annuities into a broader plan for retirement income that complements the use of other assets and sources of income while tending to the potential risks that could jeopardize retirement security (inflation, healthcare needs, etc.). In addition to being able to provide guaranteed income, options like the cash refund feature described above, the ability to structure income via joint and survivor payouts for couples, and other features can make income annuities a versatile tool for retirement planning. This versatility can be especially useful for minimizing tax impact with retirement. I do not elaborate on the taxes here, but I wrote another article on precisely that topic: Optimizing Tax Benefits with Annuities.

One last word on annuities (and life insurance)

Without doubt, the topic of annuities is often polarizing and many of the stigmas attached to them are for good reason. Having worked with individuals and families over the last decade, I have seen the good, the bad, and the ugly sides – including, but not limited to misleading sales pitches, excessively high commissions, tax inefficiencies, and poor performance. In other words, the standard of care under which annuity and insurance products are sold appears to fall short of the fiduciary standard.

I like to think my approach is different. While I uphold a fiduciary standard in all of my dealings with clients, I believe my PhD in mathematical finance, actuarial background, and Wall Street experience advising insurance companies make my perspectives on planning, investments, annuities, and life insurance truly unique. Moreover, I offer my clients multiple options: hourly/fixed-fee financial planning services, traditional fee-based portfolio management services, and income annuities (which are not necessarily mutually exclusive). By highlighting the risks, costs, and performance of each approach, I view my role as educating, guiding, and executing where applicable.

Put simply, I find there can be immense value in pre-chiseling income upfront via bond and CD ladders or income annuities. By combining this guaranteed income with other sources of income (social security, dividends, etc.), I can often structure portfolios in such a way to generate sufficient income naturally. I may be shooting myself in the foot to some degree, but I find this type of upfront planning can mitigate, if not eliminate, the need for ongoing portfolio management. As a result, this can significantly reduce both costs and taxes in many cases – thus allowing clients to spend more or leave larger legacies to their heirs.

Notwithstanding these benefits, I find the biggest benefit of this strategy is its simplicity. This building blocks approach to income is very intuitive and I find clients just get it. While this article focused on retirement income, this approach can also be used with trust planning for blended families and other situations where delineating income and principal is helpful.

Concluding remarks

I believe the true sanctity of fixed income lies in the ability to purchase specific cash flows in the future with precision and certainty. However, I believe this has become a lost art and the phrase fixed income has lost its literal meaning.

The primary benefit of fixed income assets is now seemingly derived from market prices being less volatile than or less correlated to other asset classes. Indeed, many market practitioners focus on modern portfolio theory and total return investing where all portfolio income, regardless of how robust or certain it may be, is indistinguishable from capital appreciation.

This article highlighted how we could restore the sanctity of fixed income via examples with bond ladders and income annuities. In particular, I highlighted the context of retirement income. Regardless of whether one is already retired or not, the focus of saving and investing ultimately becomes generating adequate income during retirement[9]. In this context, I believe that purchasing future cash flows with certainty can be immensely helpful.

For many, this approach may not meaningfully alter their allocations or economic exposures. If retirees were to look inside bond funds they own, then many might find the cash flows of the bonds they already own create a ladder of future cash flows they could use for retirement income planning. However, bond funds have notoriously high turnover and many of those bonds will not be held to maturity. As a result, many of those cash flows will be sold before they end up in the hands of investors who could use them.

Other articles that may be of interest:

Disclaimer

  • This document is provided for informational purposes only.
  • I am not endorsing or recommending the purchase or sales of any security.
  • I have done my best to present statements of fact and obtain data from reliable sources, but I cannot guarantee the accuracy of any such information.
  • My views and the data they are based on are subject to change at any time.
  • Investing involves risks and can result in permanent loss of capital.
  • Past performance is not necessarily indicative of future results.
  • I strongly suggest consulting an investment advisor before purchasing any security or investment.
  • Investments can trigger taxes. Investors should weight tax considerations and seek the advice of a tax professional.
  • My research and analysis may only be quoted or redistributed under specific conditions:
    • Aaron Brask Capital has been consulted and granted express permission to do so (written or email).
    • Credit is given to Aaron Brask Capital as the source and prominently displayed
    • Content must be taken in its intended context and may not be modified to an extent that could possibly cause ambiguity of any of my analysis or conclusions.
  1. Some bonds can default. For this context, I assume bonds are issued by the US government, investment grade corporations, and/or investment grade municipals.
  2. The cash flows represent those of a 10-year US government bond purchased January 1, 2011. The red market price chart is for IEF – an iShares exchange traded fund (ETF) holding 7-10 year government bonds.
  3. The term real return refers to returns above and beyond the rate of inflation.
  4. S&P reports the one-year default rate for AAA-rated bonds has been precisely 0% historically.
  5. Term premium is a theoretical concept whereby investors are generally rewarded with higher yields for investing in longer maturity bonds.
  6. Multi-year guaranteed annuities (MYGAs) are similar to CDs, but the accrued interest is not taxed until withdrawal.
  7. Please note that this 7% figure is comprised of both interest and principal. It is not comparable yields on other investments.
  8. In practice, the assets used to back income annuities are invested in a general account that does not necessarily hedge those specific cash flows. However, the economics and pricing should directly reflect these hedging costs.
  9. Of course, one must also consider events that could derail their plans (unexpected or emergency expenses such as long term care). Otherwise, even the best plans for retirement income may be vulnerable to such risks.

Optimizing Fixed Annuity Tax Deferral

Here is a link to the PDF: Optimizing Fixed Annuity Tax Deferral.
DISCLAIMER: This article discusses topics at the nexus of investments, annuities, and taxes. This article does not provide and should not be construed as providing tax advice. In order to assess tax benefits specific to annuities, we assume they are held in taxable (non-qualified) accounts unless otherwise specified.
OVERVIEW

Annuities are popular tools for retirement income planning. While stigmas exist around some annuity products (for good reason), recent research shows how fixed annuities can add value in the context of retirement income. In addition to being able to guarantee income for life, tax benefits are often advertised as a key advantage of using annuities. This article discusses the mechanics of tax deferral in annuity products[1].

We first consider variable and indexed annuities and how the value stemming from their tax deferral can be diluted or even negated due to the growth eventually being taxed as income rather than capital gains. For fixed annuities, this is less a concern as bond interest is already taxed as income. So we explore ways to maximize their tax deferral benefits.

We explain the concept of the exclusion ratio and how it relates to the taxation of fixed annuities. We then provide multiple examples and intuition that lead to a novel approach for optimizing tax-efficiency. By exploiting the manner in which the exclusion ratio is applied, we find our approach allows us to reduce taxes by as much as 12% relative to standard fixed income investments for investors with a marginal tax rate of 25%.

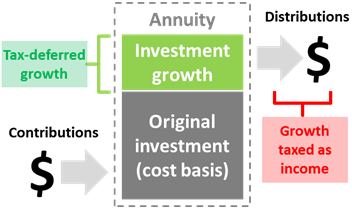
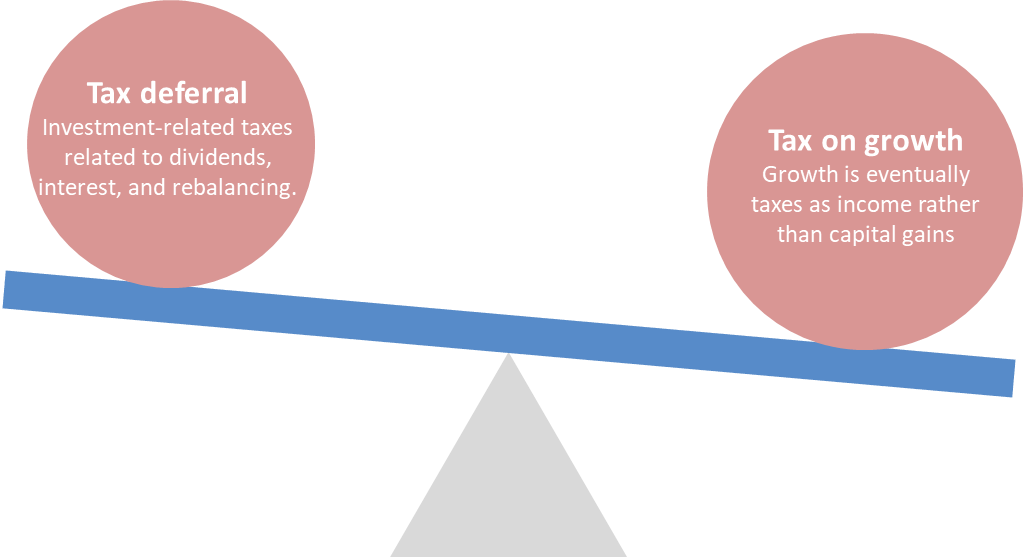
Figure 1: Tax deferral vs growth taxed as income

Figure 1: Tax deferral vs growth taxed as income

Source: Aaron Brask Capital

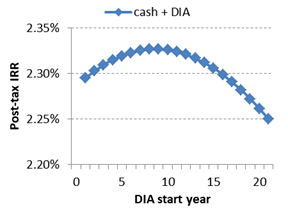
Figure 2: Optimizing tax deferral with DIA start date

Figure 2: Optimizing tax deferral with DIA start date

Source: Aaron Brask Capital

Background

Annuities have become a popular tool for retirement income planning. Cynically speaking, we would say commissions have always been a motivating factor for agents to push annuity products – especially the most expensive products. However, that is not to say all annuities are bad. Indeed, some can offer useful benefits. Our research and that from other practitioners and academics highlight many of the advantages fixed annuities can provide to investors and retirees, in particular.

We believe the primary benefit of annuities is their ability to guarantee income throughout one’s lifetime. This is an undeniably attractive feature (and compelling sales pitch) that can only be achieved via annuities[2]. Our concern naturally lies on the cost side of the equation. Indeed, our research and experience indicate the fees associated with more complicated annuity products typically outweigh (or at least dilute) the benefits of guaranteed lifelong income. For example, variable annuities are often saddled with expensive (and in our view, unnecessary) bells and whistles that make them prohibitively expensive.

Of course, insurance companies are in business to profit. So fixed annuities embed costs too. However, we have observed them becoming increasingly competitively priced and suspect this is due to three key factors:

  1. Their simplicity makes them easy to hedge. Actuaries can use mortality tables to work out the expected cash flows with good precision.
  2. Their simplicity makes them easy to compare. So it easier for independent insurance agents, like us, to obtain multiple quotes from high quality insurers and find the best value for our clients.
  3. Annuities help insurers balance longevity risks. For their bread and butter life insurance business, shorter lifespans present a risk because it means they have to pay off liabilities sooner. For annuities, the risk is generally the opposite as longer lifespans translate making more payments.

Our research and experience corroborate the findings from the increasing body of academic and practitioner literature showing that income annuities can add significant value in the context of retirement. On balance, we find these types of annuities to be an extremely useful and cost-efficient planning tool for many retirees. So we are not surprised to see these products becoming increasingly popular.

This article focuses primarily on the tax deferral benefits annuities can provide and is broken down into two sections. The first section discusses how tax deferral benefits are affected by the way annuity earnings are taxed upon distribution (i.e., as income). This is a known issue, but worth repeating. The second section highlights what we believe to be a new and useful strategy to create and maximize expected tax deferral benefits with fixed annuities in taxable accounts.

Note: To be clear, this article focuses on tax benefits; it does not delve into the absolute costs of annuity products – generally a more important consideration (i.e., do not let the tax tail wag the dog). For example, fixed annuities do not come with price tags outlining their fees. Instead, they embed their costs in their payouts. So it is important to assess their payouts in the context of current interest rates offered by relevant bond investments. Given the technical nature of these calculations (e.g., actuarial/mortality/life tables), we provide both tax and cost analyses to clients interested in annuity (or life insurance) products.

Annuity tax deferral versus taxes on distributions

One of the benefits of annuity products is tax-deferral. That is, growth is not taxed until it is distributed outside the annuity[3]. This tax deferral is often a major selling point, but there is a downside; the growth or earnings is eventually taxed as income. This can be quite punitive as income tax rates are generally significantly higher than capital gains rates.

Figure : 2020 Income and Capital Gains Marginal Tax Rates[4]

Income Income tax Long term capital gains Difference
$100,000 22% 15% 7%
$250,000 24% 15% 9%
$500,000 35% 20% 15%
$1,000,000 37% 20% 17%

Source: IRS

Figure 3 highlights the marginal income and capital gains tax rates for a variety of income levels. The difference between the two becomes greater for higher earners and this can make the tax aspects of annuities less attractive. Let us consider the simple example of $100 invested in a non-dividend-paying stock held by a couple in the highest tax bracket to illustrate the impact. If the stock grew by 10% per year over 10 years, then withdrawing those funds would leave $227.50 in a taxable brokerage account after capital gains taxes. If the same investment was held within an annuity and withdrawn after 10 years, they would end up with just $200.41 due to the gains being taxed at the higher rate (as income).

Of course, the above example was contrived to illustrate a point. In most situations, one will hold stocks and stock funds that pay dividends, bonds with taxable interest, and their portfolios will be rebalanced. All of these factors create tax drag when held in a taxable brokerage account, but not within an annuity. The point is that there are two potentially offsetting tax factors at play: the tax deferral during the growth phase and the ultimate tax rate applied to the growth.

Even if we can estimate the impact from the latter factor, there is no simple formula to estimate the impact of tax deferral as the factors we mentioned (dividends, interest, and rebalancing) can be different each year and their impact depends on the investors’ financial and tax situation. Notwithstanding, we used historical simulations to estimate these benefits for various types of portfolios and investors. These results are presented in two articles we published entitled Quantifying the Value of Retirement Accounts and Illustrating the Value of Retirement Accounts. Using the results from these articles, one can estimate the tradeoffs between these two tax factors.

Figure : Balancing Tax Factors

Source: Aaron Brask Capital

There are other factors related to tax that can make annuities less attractive. For example, annuities do not receive a step-up in basis. So their embedded gains will also carry the corresponding tax liability which will eventually be taxed as income as distributions are taken by the beneficiaries.

On balance, we believe the tradeoffs between the tax-related issues highlighted above make annuities inefficient vehicles for most stock allocations[5]. We find the cost of taxing their growth as income (versus capital gains) is simply too high in most situations. However, the tradeoff for bonds is different since their interest and appreciation[6] is already taxed as income. In particular, the tax deferral provided by annuities is still helpful, but taxing their growth as income is not necessarily punitive as it would be taxed that way already without the annuity. The next section discusses how they are taxed and presents a novel approach for optimizing the tax deferral benefits for fixed annuities.

Maximizing tax deferral for fixed annuities

Note: This section discusses fixed annuities. That is, we focus on annuities whereby one exchanges a lump sum of money for a stream of cash flows that may start immediately or at a later date and may or may not last throughout one’s lifetime. To be clear, our discussion does not include index annuities (a.k.a. fixed index annuities). While index annuities are often grouped together with fixed annuities, they are tied to the performance of one or more underlying indices (e.g., S&P 500) rather than fixed payouts or interest rates.

This section is broken down into four sections. The first describes three types of fixed annuity products we consider for our analyses. The second section discusses how annuity taxation differs from standard investments in taxable accounts. In particular, it explains the concept of the exclusion ratio and how it can provide tax deferral benefits with annuities. The third section provides examples of how various annuity strategies can be used to exploit the exclusion ratio mechanics and improve one’s after-tax outcomes. The fourth section delves deeper into these strategies to optimize the results based on where DIA cash flows start.

Types annuity products we analyze

We consider three primary fixed annuity products to assess tax efficiency versus using standard interest-bearing investments in taxable accounts. The first product is called a single premium immediate annuity (SPIA). This involves paying an upfront lump sum of money in exchange for cash flows that will start immediately (typically with 12 months) and continue until the annuitant passes. The second product, a deferred income annuity (DIA), is similar to a SPIA in that it is funded with an upfront lump sum, but its cash flows are deferred and start at a later date (typically after at least 12 months).

For SPIA and DIA products, we assume they embed a feature known as a cash refund. This will insure these annuities always return at least as much premium as was invested. We find this is a desirable option in practice, but it also makes the annuities more comparable to cash allocation strategies since they would both leave cash balances if the annuitant passed before their expected lifespan.

The third product is a multi-year guarantee annuity or MYGA (a.k.a. a fixed rate annuity since the rate of interest is fixed upfront). In effect, a MYGA can be used to purchase a future cash flow at a discount. This is similar to a zero-coupon bond or certificate of deposit (CD) whereby you select a desired maturity, invest your money, and then that money grows until its maturity according to the embedded interest rate. However, the MYGA also provides tax deferral.

We also analyzed fixed period annuities. Like SPIAs and DIAs, one pays for a fixed period annuity upfront and receives a stream of income. However, the income is limited to a pre-specified period and is not guaranteed throughout one’s life like SPIAs and DIAs. We use a fixed period annuity in an example below to illustrate annuity tax deferral benefits, but we did not include their results in the main analysis further below because they were only marginally different than the other products we considered.

Fixed annuity tax basics (the exclusion ratio)

In order to understand the tax benefits annuities can provide, we make some simplifying assumptions:

  • A fixed interest rate of 3%
  • A flat income tax rate of 25% applies to bond interest

Now let us consider an investor who would like to allocate enough cash[7] to provide after-tax proceeds of $10,000 per year for 10 years. Given that each dollar invested will earn 2.25% after tax (3% gross return net of 25% tax), netting $10,000 N years later requires an initial amount of capital equal to $10,000 ÷ (1 + 2.25%)N. In our case, the total capital required to fund 10 years of $10,000 spending works out to $88,662.

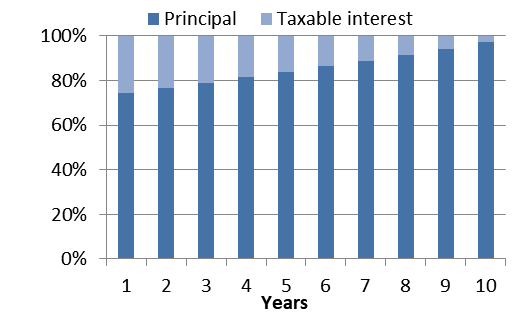
In year one, there will be $2660 (3% x $88,662) of interest on our cash portfolio, $665 (25%) taxes will be paid on that interest, and the investor will withdraw $10,000. This (and every) withdrawal is larger than the after-tax interest. So a portion of each withdrawal will come from the principal and naturally deplete the capital over time (by construction, it will go to zero after 10 years). As a result of the reduced principal, the amount of taxable interest will be highest early on and decrease each year.

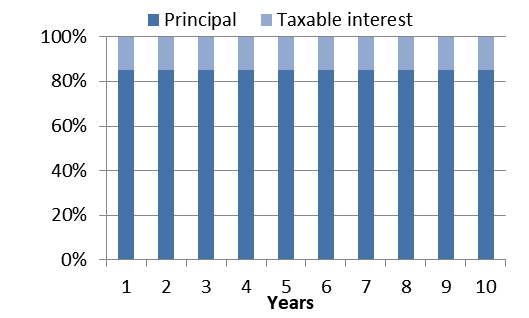
Figure : Tax profile illustrations

Taxable cash allocation (front-loaded taxation)

Taxable cash allocation (front-loaded taxation)

Fixed period annuity (level taxation)

Fixed period annuity (level taxation)

Source: Aaron Brask Capital

Fixed annuities offer an advantage relative to this front-loaded taxation. The IRS[8] effectively allows for level taxation of income annuities via a calculation based on the exclusion ratio. The exclusion ratio is calculated and provided as part of an annuity contract in order to determine how much of each distribution will be excluded from taxation. It is intuitively calculated as the amount of the original investment divided by the total expected payout[9] (original investment + return).

Figure 5 above illustrates the tax profiles for a cash allocation designed to generate the same after-tax $10,000 per year versus a fixed period annuity paying the same cash flows over a 10-year period. The benefit of the level taxation an annuity can provide is that it translates into lower taxes in the beginning (relative to the front-loaded taxation of interest-bearing cash) – thus allowing for more tax-deferred compounding. The benefit of this extra tax deferral is minimal in this example (i.e., the fixed period annuity tax deferral only saved $106), but the next section investigates strategies to make the benefits more significant.

Leveraging exclusion ratio mechanics to improve tax deferral

Now that we have explained the concept of the exclusion ratio and how it works, we look at ways to use it to our advantage. The context for this discussion will be a 65-year-old female retiree who would like to generate $10,000 of after-tax income per year for the rest of her life.

We naturally cannot predict how long she will live. So it is impossible for us to know how much cash one would need to allocate and compare to annuity strategies with lifelong income. However, this turns out to be irrelevant for this analysis since the exclusion ratio and its tax deferral benefits only apply throughout one’s actuarially expected lifespan.

Note: Annuity income becomes 100% taxable if one lives beyond their expected lifespan because all principal has been returned by then. That is, further income is 100% return and thus 100% taxable. However, taxation becomes an ancillary issue as the primary benefit of an income annuity at this point stems from the fact there is any income at all to be taxed (i.e., the cash allocation strategy would be depleted).

Accordingly, one’s expected lifespan is the only period we need to consider and we can thus determine the specific amounts required to construct our baseline cash allocation strategy for comparison. We use an expected lifespan of 20 years for our hypothetical 65-year-old female retiree[10]. As a base case, the cash allocation strategy requires $159,637 to generate $10,000 per year for spending (i.e., after tax).

In order to compare the results from different strategies, we utilize a methodology similar to that used by Joe Tomlinson (actuary and retirement researcher) in this article. That is, we calculate the internal rate of return (IRR) of each strategy on an after-tax basis. To be clear, we generate the same $10,000 after-tax income per year and assume the same pre-tax rate of return. So the difference in initial investment required for each approach will be a direct result of its tax deferral benefits and be reflected in its post-tax IRRs (i.e., higher IRRs indicate more deferral and tax efficiency).

Figure : Comparing after-tax IRRs

After-tax IRR Effective tax rate Effective tax cut[11]
Cash allocation 2.25% 25.0% 0%
SPIA 2.30% 23.5% -6%
Cash allocation + DIA 2.33% 22.5% -10%
MYGA ladder + DIA 2.34% 22.1% -12%

Source: Aaron Brask Capital

We also use the after-tax IRR to calculate and compare the effective tax rates[12] of these strategies. For reference, cash allocations involve no tax deferral. So their effective tax rate and after-tax IRR will always be precisely 25% and 2.25% (3% return net of 25% income tax), respectively.

We now consider three alternative approaches using fixed annuities. The first approach we consider is the simple SPIA. The benefit of its level taxation results in an after-tax IRR of 2.30%. This is a slight improvement over the 2.25% after-tax return of the cash strategy and reduces the effective tax rate from 25% to 23.5%.

The next two approaches break the 20-year period into two 10-year periods. While both use a DIA for the latter period, we provide income for the first 10 years in two different ways: via a cash allocation and a ladder of individual MYGAs. Recall from our description above that MYGAs are annuities that allow one to invest a sum of money with a pre-specified interest rate over a particular multi-year period of time – similar to CDs or zero-coupon bonds.

Each approach is taxed differently and thus yields different after-tax results. We present these results next to those for the cash allocation strategy and SPIA in Figure 6 above. Just as the SPIA’s level taxation improved the tax deferral benefits versus the cash allocation, introducing the DIA further improved the results by completely deferring taxes for the first 10 years and then leveling the accrued taxes over the latter 10-year period.

It is worth noting the cash allocation for the first 10 years suffered from the same tax front-loading issue, but was only relevant to just over half of the overall investment with the balance being invested in the DIA. This front-loading tax issue was addressed by using the ladder of MYGAs. In fact, the annuity ladder actually back-loads the taxation[13] and creates an even more favorable result than level taxation would have.

Figure : Tax profile illustrations

Fixed period annuity (level taxation)Fixed period annuity (level taxation) MYGA ladder (back-loaded taxation)MYGA ladder (back-loaded taxation)

Source: Aaron Brask Capital

Using the DIA with a cash allocation for the first 10 years increased the after-tax IRR from 2.30% for the SPIA to 2.33% with the DIA and reduced the effective tax rate by another full percent[14] to just 22.5%. Replacing the cash allocation with the MYGA ladder further increased the after-tax IRR to 2.34% and reduced the effective tax rate to 22.1%.

In summary, the above strategies were able to increase the after-tax IRRs by just under nine basis points (0.09%). While this figure may sound small, it is amplified to the extent it applies to all of the compounding for all of the cash flows from year one to year 20. Another way to look at it is to consider the absolute amount of taxes paid on the investments. In this context, the benefit of the annuity tax deferral was able to reduce overall taxes paid by as much as 12%.

Optimizing

Now that we have observed how the exclusion ratio and corresponding tax deferral benefits differ for various approaches, we explore a simple strategy to try and maximize those benefits. In our previous examples, we split the 20-year period into two equal halves and seemed sensible. However, this 10-10 split was still arbitrary. Following along with our hypothetical 65-year-old female retiree, we assume the same 20-year period as before, but we alter the point at which we start the DIA cash flows and see how it impacts the results.

We first look at the approach using the cash allocation with a DIA. The following two charts show how changing the DIA starting year impacts the after-tax IRR and effective tax rate. It is worth nothing that starting the DIA in year one is equivalent to the SPIA approach and starting it after year 20 is equivalent to the cash allocation approach (no annuity). The dark blue lines in Figure 8 represent this approach and indicate the IRR is maximized (and the effective tax rates is minimized) when the DIA is started in year nine. So the 10-year DIA start we used before turns out to be near optimal when combining it with a cash allocation.

Figure : IRR and effective tax rate for varying DIA starting dates

IRRIRR Effective tax rate
Effective tax rate

Source: Aaron Brask Capital

We repeated the same analysis for the approach with a MYGA ladder and DIA. Those results are represented by the light blue line in Figure 8 above. In this case, the IRR increased and the effective tax rate decreased in a monotonic fashion from years one to 20. This is a direct result of the favorable (back-loaded) taxation the MYGA ladder offers. As the charts indicate, the marginal benefit of starting the DIA later is significant in the early years, but diminishes through time. As a result, it may be sensible to start the DIA around 10-year mark as there is minimal benefit beyond that point (e.g., to ease the administrative burden involved with filling out 20+ annuity applications). Alternatively, one could utilize a fixed period annuity instead of the MYGA ladder. This achieves much of the tax deferral benefit via its level taxation, but only requires a single application.

Concluding remarks

This article focused on tax-related aspects of annuities, but we do not advocate letting the tax tail wag the dog. There are, of course, many other important factors one should consider. Indeed, we find the fees and embedded costs associated with many products make them prohibitively expensive – regardless of their tax-efficiency or other benefits. Liquidity constraints and surrender penalties should also be considered.

Our research and experience indicate fixed annuity products can be both cost- and tax-efficient tools for retirement income planning. The embedded costs of fixed annuities are specific to each policy (age, gender, current market rates, etc.) and should be considered on an individual basis. However, the rules governing their taxation do not change and that is why this article focused on strategies to maximize their tax efficiency.

Below we list what we believe are the primary points made by this article. We also highlight several other non-tax-related points we did not discuss, but are also worth considering in the context of annuities.

Primary points made in this article

  • We find annuities are neither cost- nor tax-efficient investment vehicles for equity-related allocations (e.g., variable or fixed index annuities)
  • Fixed annuities can be more cost-efficient – especially when an independent agent obtains quotes multiple insurance companies
  • Fixed annuities offer tax deferral advantages over standard cash allocations due to how the exclusion ratio can level taxation
  • One can exploit the mechanics of the exclusion ratio to maximize tax deferral benefits
Additional points unrelated to taxes

  • Using a cash refund option on a fixed annuity can offer an attractive form of insurance relative to standard fixed income investments – especially in a low interest rate environment
  • Income annuities can increase tax predictability in both taxable and qualified retirement accounts
  • A qualified longevity annuity contract[15] (QLAC) can defer some RMDs by more than 10 years.

Notes (the good, the bad, and the ugly of annuities)

  • The topic of annuities is often polarizing and many of the stigmas attached to them are for good reason (e.g., advice is often biased to favor products with higher commissions versus a fiduciary mindset).
  • I have a PhD in mathematical finance and started out along an actuarial track. In my previous career, I worked with different insurance companies to hedge risks within their annuity books.
  • Having worked with individuals and families over the last decade, I have reviewed many portfolios and seen the negative impact from various high-commission and poor performing insurance products.
  • So I have seen the good, the bad, and the ugly in the context of annuities and life insurance.

Disclaimer

  • This document is provided for informational purposes only.
  • We are not endorsing or recommending the purchase or sales of any security.
  • We have done our best to present statements of fact and obtain data from reliable sources, but we cannot guarantee the accuracy of any such information.
  • Our views and the data they are based on are subject to change at any time.
  • Investing involves risks and can result in permanent loss of capital.
  • Past performance is not necessarily indicative of future results.
  • We strongly suggest consulting an investment advisor before purchasing any security or investment.
  • Investments can trigger taxes. Investors should weight tax considerations and seek the advice of a tax professional.
  • Our research and analysis may only be quoted or redistributed under specific conditions:
    • Aaron Brask Capital has been consulted and granted express permission to do so (written or email).
    • Credit is given to Aaron Brask Capital as the source.
    • Content must be taken in its intended context and may not be modified to an extent that could possibly cause ambiguity of any of our analysis or conclusions.
  1. While this article highlights annuity strategies to maximize the tax efficiency, one must consider the bigger picture including price paid and value delivered. As we highlight multiple times within the article, taxes are just one consideration.
  2. Insurance companies are the only entities that can provide payouts based on lifespans (e.g., life insurance and lifetime income).
  3. Please see IRS Publication 575.
  4. These figures assume married filing jointly (MFJ) status and do not include standard or itemized deductions, the net investment income tax, or Medicare surcharge.
  5. We are referring to standard equity portfolios and strategies – as may generally be found in tax-efficient exchange traded funds. However, the tax deferral benefits may be suitable for more complex, higher-turnover (i.e., tax-inefficient) strategies.
  6. Bonds purchased at a (market) discount will appreciate toward par and this appreciation is generally taxed as ordinary income.
  7. Given we are assuming a fixed interest rate, the math for the interest and taxes works out the same whether one views this as a ladder of bonds over the 10-year period or a money market account with the same initial capital.
  8. See IRS Publication 939 for specific details.
  9. In the case of lifelong income (immediate or deferred), the expected payout is based on one’s actuarially expected lifespan. However, payments beyond the expected lifespan will be fully taxable.
  10. Social Security actuarial tables indicate 20.49 years.
  11. Relative to the cash allocation approach with the original 25% tax rate.
  12. In line with Tomlinson, we calculate the effective tax rate as the difference between the before- and after-tax IRRs divided by the before-tax IRR. That is, effective tax rate = [ BT_IRR – AT_IRR ] ÷ BT_IRR.
  13. This is a result of using 10 different annuities each with their own exclusion ratio. In practice, this involves 10 (well, 11 if we include the DIA) annuity applications. Given the administrative burden this may impose, the aggregation rules around annuities purchased within the same year, and the slight marginal benefit, one may prefer to replace the MYGA ladder with a single fixed-period annuity.
  14. To be clear, this is an absolute reduction in the effective tax rate; we could have been more dramatic by claiming this reduced the taxes by 4.2% (22.5% ÷ 23.5% – 1).
  15. A QLAC is effectively a deferred income annuity inside a qualified retirement account.


Dividends Are Different

Here is a link to the pdf: Dividends Are Different.
OVERVIEW

There has been abundant discussion regarding the utility of dividends. Many investment models rely on factors or other strategies in their attempt to increase returns or reduce volatility. These approaches generally focus on total returns and brush dividends under the rug. Some go further and argue specifically against dividends – occasionally likening dividend advocates to sacred cow worshippers. The low dividend yields and strong capital appreciation we have observed in recent years has probably diminished the reputation of dividends as well. On balance, we find the art and science of dividends has largely been forsaken.

This is a pro-dividend article. While we acknowledge some issues with dividends (e.g., inefficiencies in how they return capital to shareholders), we find many investors and practitioners do not fully understand or appreciate some of the key attributes that can make dividends useful – especially in the context of retirement income.

This article discusses some pros and cons of dividends. We also weigh in on previously-discussed issues and share what we believe are some new perspectives. Some of claims we revisit/challenge are:

  • Synthetic dividends are the same as real dividends
  • Dividends are equivalent to buybacks when returning capital to shareholders
  • Dividends comprise the bulk of total returns investors experience

As the title suggests, the primary goal of this article is to explain what makes dividends different. We believe it is important to acknowledge the intrinsic fundamental nature of dividends. In particular, this creates a unique value proposition in that dividends can provide investors with a growing stream of income that is largely independent of market volatility.

On balance, we believe dividends are a powerful financial planning tool many retirement models seem to neglect. Please stay tuned for our future article(s) were we will present a retirement income strategy that leverages some of the benefits discussed in this article.

Figure 1: Achieving the same result via different actions

Figure 1: Achieving the same result via different actions Figure 1: Achieving the same result via different actions

Source: Aaron Brask Capital

Content summary

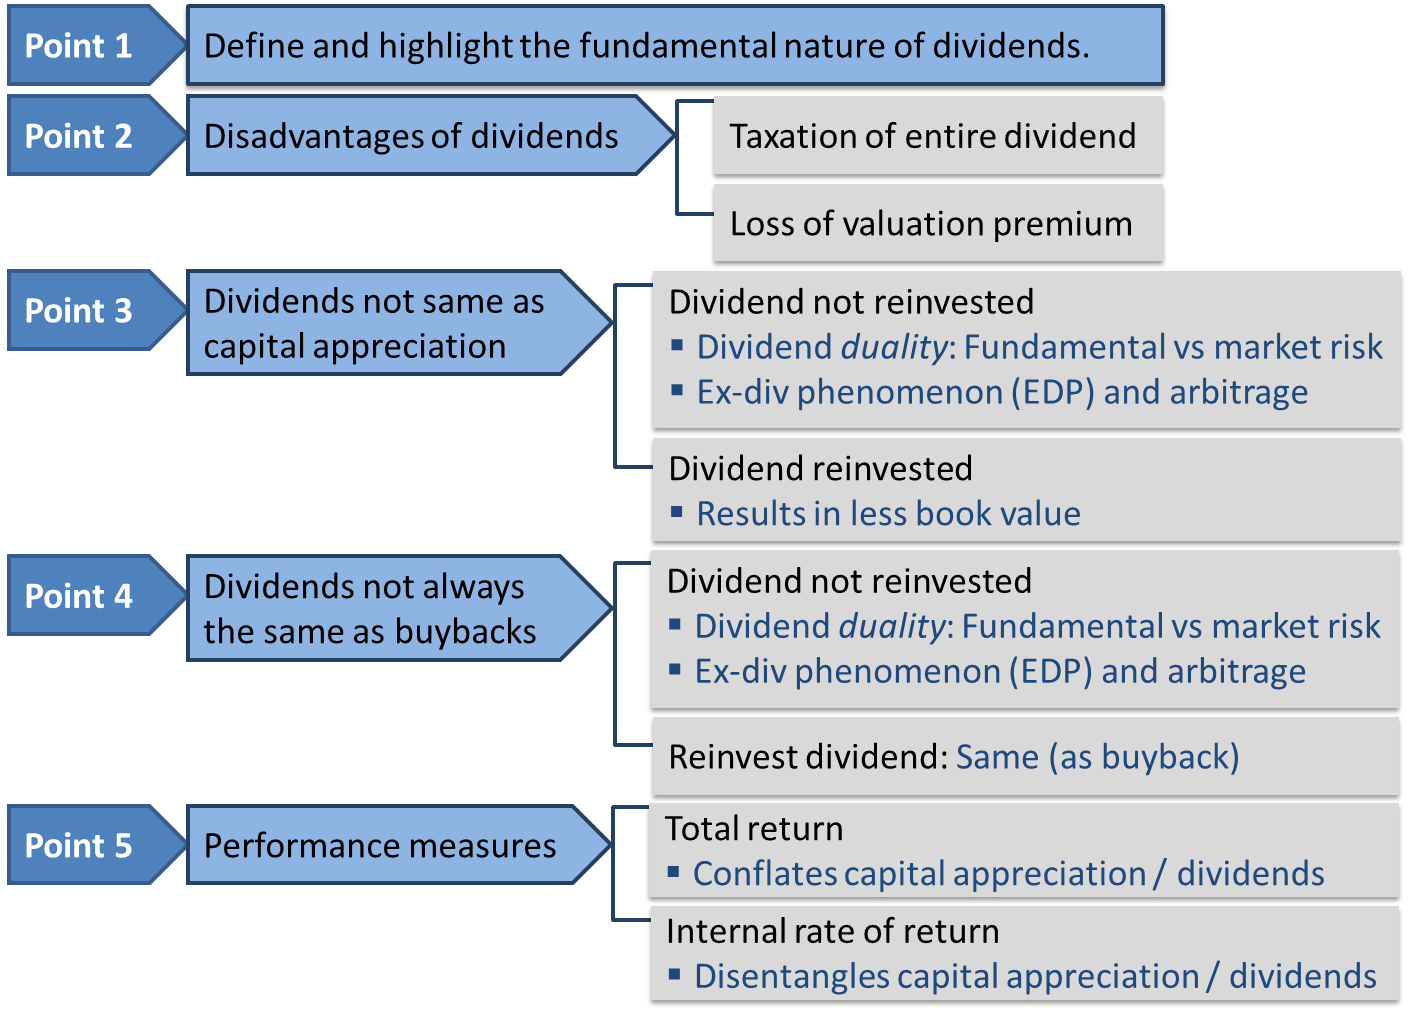
We first explain what a dividend is and highlight its fundamental (as opposed to market-based) nature – a critical notion that resonates throughout the rest of the article. We then discuss two key issues regarding how dividends may be an inefficient means of returning capital to shareholders. The following two sections challenge popular claims regarding dividends and how they are related to market returns and buybacks. The penultimate section (before our concluding remarks) discusses the relevance of calculating performance via total returns versus internal rates of return in different contexts and shares related empirical observations.

Figure 2: Executive summary

Figure 2: Executive summary

Source: Aaron Brask Capital

What is a dividend?

A dividend is a direct cash[1] payment from a company to its shareholders. Of course, if you hold stocks and/or stock funds at a broker or custodian (e.g., Charles Schwab), then they will simply facilitate that payment by transferring the funds from the issuer to your account. In many cases, they will take your dividend and reinvest it by purchasing more shares of the stock via an automated DRIP (dividend reinvestment plan). A key point here is that dividends are paid directly from the operating business to shareholders. So they depend on the fundamental performance of the business and effectively bypass stock market volatility[2].

Figure 3: Dividends bypass market volatility

Figure 3: Dividends bypass market volatility

Source: Aaron Brask Capital

Of course, economic cycles and stock markets are related. For example, market collapses often occur around the same time as recessions. During these periods, the overall market’s fundamental performance (e.g., earnings) can slow or turn negative and result in dividends cuts. Based on these observations, some may be tempted to equate dividend risk and market volatility. However, this logic is not sound.

If we control for cyclical versus non-cyclical businesses (without a look-ahead bias), then the linkages between fundamentals, market prices, and dividends becomes more clear. For example, our data shows that dividends of non-cyclical businesses were significantly more robust than those from cyclical businesses during the last recession (i.e., the credit crisis) and other turbulent periods. While markets may have thrown out the babies (share prices of non-cyclical business) with the bath water (share prices of cyclical businesses), the underlying fundamentals were real drivers of dividend performance. We will revisit this notion and provide more data in our next article.

Another way to recognize the fundamental versus market–based nature of dividends is to consider a private company paying a consistent stream of dividends to its shareholders. Based on the operating performance of the business and management’s decisions, those dividends are 100% fundamental in nature. There isn’t even a market price to consider since it is a private company. Now let us consider what happens if this company went public with an IPO[3] but continued its policy of paying dividends. The company’s shares would trade on an exchange, but such trading would not alter the fundamental nature of the dividend cash flows.

Note: Recognizing this fundamental versus market-based nature of dividends is important as many of the arguments we put forth in the rest of this article rely on it.

Dividend disadvantages

Before we address some common misconceptions regarding dividends, we first acknowledge two related disadvantages. Both of these factors highlight potential inefficiency in how dividends return capital to shareholders.

The first and most straightforward issue relates to taxes. The crux of the disadvantage is that dividends are typically taxed in their entirety. Even if we use the same tax rate (i.e., long-term capital gains rates for qualified dividends), only the capital gain component of stock sold (i.e., not the cost basis) is taxed – not the entire dollar amount of stock sold. In this sense, dividends impose additional tax friction relative to selling one’s holdings and this imposes a real cost.

Assuming a hypothetical (qualified) dividend yield of 2% and long-term capital gains tax rate of 20%, dividends would impose approximately 40 basis points (20% x 2%) of tax drag. If the stock were flat or down, then there would be no capital gains tax for selling shares to create a synthetic[4] dividend. Only holdings with extremely low cost basis (i.e., the position is mostly capital gain) would trigger a similar magnitude of taxes upon selling.

The other issue we highlight relates to valuation. Consider an investor who reinvests dividends in a company. The dividend represents a direct transfer of book value[5] from the balance sheet to the shareholder on a dollar for dollar basis (i.e., each dollar of dividend reduces the book value by one dollar[6]). However, when reinvesting the dividend, this investor will likely repurchase book value at a premium (i.e., the price to book ratio is typically greater than one). This is effectively buying high and selling low (albeit in the opposite order). Warren Buffett touched on this topic and shared an illustrative example in his 2012 annual letter. There are multiple assumptions and nuances embedded his analysis,[7] but the conclusion is straightforward: returning capital via dividends can negatively impact investors.

Returns from dividends are not the same as capital appreciation

Conventional wisdom amongst many academics and practitioners is that dividends are the same as capital appreciation for all intents and purposes.[8] They assume one should be indifferent to receiving dividends versus selling shares to generate the same level of income. We disagree. The following two subsections highlight and refute what we believe are the two most popular pieces of evidence (academic research and the ex-dividend phenomenon) used to argue for dividends’ equivalence to capital appreciation.

Popular research article(s)

Perhaps the most popular research articles commonly referenced in this context is a 1961 paper entitled Dividend Policy, Growth, and the Valuation of Shares by Merton H. Miller and Franco Modigliani (M&M). The article starts out by assuming “… an ideal economy characterized by perfect capital markets, rational behavior, and perfect certainty.” We find each of these assumptions rather unrealistic. So we are naturally skeptical of any conclusions based on all three. Notwithstanding, we will try to highlight where we believe their logic does not gel with the real world.

First, let us consider Buffett’s 2012 annual letter highlighted above where he unambiguously argues dividend policy does matter for investors. Taking Buffett’s words for gospel, we might be tempted to stop there. However, it is more informative to reconcile these two theories and get to the heart of the matter. We break this challenge down into two scenarios: one where the dividend is spent and the other where it is reinvested.

In the case where a dividend is kept or spent (i.e., not reinvested), this income comes directly from the company and is thus fundamental in nature – not impacted by the daily noise in the market. However, if one were to create a synthetic dividend via selling stock, the price of the stock would matter. For example, any market noise on that day (e.g., a Trump tweet) could change the price and hence the number of shares one would need to sell, but would not alter a dividend payment. The essence of risk is different (fundamental vs market-based) and we believe this differentiates real dividends from synthetically generated dividends and capital appreciation, both of which are clearly impacted by market noise.

The potentially more interesting case to consider is when a dividend is reinvested. The discussion and calculation of stock returns[9] in the M&M paper indicates there is an embedded assumption the money would not be spent but remain (re)invested. A fair question to ask is: What if the market prices were different that day? Then the investor would purchase either more or fewer shares with that dividend. Moreover, they would still generally end up owning less book value than if the dividend were not paid. This is due to the transition of each dollar of dividends from the balance sheet to the shareholder. As highlighted above, the market typically values each dollar on the balance sheet at a premium (i.e., the price to book value is usually greater than one). However, once it is passed on to shareholders, it is just a dollar. So when each dollar of dividend is reinvested, it purchases less than one dollar of book value.

The net result is the shareholder owning less book value. If that dollar were left on the balance sheet and put to productive use within the company (even if the marginal rate of ROA or ROE was slightly lower), it would still be valued at a premium. So the payment of a dividend (versus no dividend) clearly has an impact on what shareholders own and thus pokes a hole in the M&M paper’s conclusions.

Concept: Dividend duality

In our view, dividends represent a unique phenomenon in that they straddle (pierce) the veil between corporate fundamentals and markets prices.[10] The M&M paper ignores this subtle but interesting dichotomy. We are by no means saying this was an intentional omission; it is simply a byproduct of their framework that does not look below the surface of market prices to consider fundamental performance or valuation. Instead, their starting point was efficient markets. So their assumptions did not allow for the possibility of such an inconsistency (i.e., dollars inside the company may be valued more than dollars outside).

Of course, it is not surprising there is some discrepancy on the matter since M&M’s assumptions regarding market efficiency are at odds with Buffett’s take on markets and picking stocks. Indeed, one might say our view on fundamentals and markets represents a bottom-up perspective. We believe there are fundamentals and that prices generally follow them over the long run. However, the M&M paper takes a top-down perspective. They effectively assume the market is right and reverse engineer conclusions from there.

We suspect this fundamental versus market duality of dividends is not compatible with many of the market models and assumptions used in academia and practice. In their white paper entitled The Dividend Disconnect, Samuel M. Hartzmark and David H. Solomon (H&S) identify and discuss behavioral patterns related to dividends that many investors exhibit. Their paper starts with a quote (from James MacKintosh of the Wall Street Journal) that glorifies dividends as being the rightful “arbiter of stock-market value.” Then they highlight the irrelevance of dividends (versus, say, synthetic dividends or capital appreciation) based on the M&M paper. This concept provides the basis for their analysis whereby they make interesting observations regarding investors’ behaviors around dividends that are seemingly irrational given the assumption of dividend irrelevance. They even go as far as to put forth the notion of the free dividend fallacy whereby some investors may view dividends as being free and not impacting the corresponding stock prices.

We find ourselves somewhere in the middle. On one hand, we do not believe dividends are free or that they are the ultimate rightful “arbiter of stock-market value.” On the other hand, we do not find them irrelevant either. Given our healthy respect for dividends and their fundamental/market duality, we find the observations from the H&S paper unsurprising. We suspect many of their conclusions are the result of widely varying utility functions digesting this duality differently. For example, savers in the accumulation phase and retirees focused on income may perceive and value dividends very differently. It may simply be the case that dividend-paying stocks should be analyzed in a different manner than companies that do not pay dividends. Accordingly, many existing market models may need refinement to better accommodate this concept of dividend duality.

Geek’s note

Here we mathematically interpret and reconcile the assumptions behind the M&M paper and those described in Buffett’s 2012 annual letter. First their respective formulas for stock returns:

ρMM (t)=(p(t+1)+d(t))/p(t) -1

Miller/Modigliani: where ρ represents the return over period t, is the price at time t, and is the dividend paid at time t.

ρWB (t)=(p(t)×(1+ROE)-(MTB-1)×d(t))/p(t) -1

Warren Buffett: where is the assumed return on equity and is the assumed market to book ratio (a.k.a. price to book).

The first formula is a taken directly from the M&M paper with minor algebraic manipulation. The second formula is our translation of Buffett’s framework from the 2012 annual letter. The real world of fundamentals and markets naturally do not conform to either of these rigid models, but we believe the formulas can help us illustrate a couple points.

First, the numerator of the fraction describing Buffett’s return grows book value by the ROE, but then subtracts a second term. That second term effectively represents a penalty for dividends. On the balance sheet, those dollars of equity are valued at a premium (MTB), but they are regular dollars when passed shareholders. Note: In the absence of dividends, the return on the stock is the same as the ROE in his framework – an observation we find sensible.

Second, the M&M formula for return involves no fundamental factors. In fact, the returns are exogenously defined so that they are equal for all stocks. So the formula does not represent a function whereby independent variables are combined to calculate a dependent variable (as is the case with the formula based on Buffett’s framework). Instead, the variables on the right side of the equal sign are effectively there to conform to the return on the left side. This effectively highlights the mathematical distinction between the top-down M&M model and Buffett’s bottom-up framework.

The ex-dividend phenomenon (EDP)

The ex-dividend phenomenon (EDP) describes the pattern whereby stock prices tend to decline by the amount of their dividends once they trade ex-dividend. There is much research supporting this hypothesis and our findings corroborate it as well. However, there are many who cite the EDP as empirical evidence or conclusive proof of the equivalence between dividends and market prices. This is where we disagree. To be sure, we would not be convinced even if ex-dividend price declines perfectly reflected the dividend amounts in every instance.

According to Buffett’s example and our concept of dividend duality, it may be the case that some value is destroyed at the instant when cash for dividends leaves the balance sheet and goes to shareholders. I have not seen or heard of any such models, but it is possible markets decompose stock values into their future reinvested earnings and their dividend stream. These models could even discount the price to reflect the value destruction highlighted above. So dividends would effectively accrue,[11] but they would be valued separately from other book value on the balance sheet.

Under these contrived market model assumptions, dividend duality would no longer be a concern as the balance sheet cash earmarked for dividends would be accounted for separately and could thus make a more seamless transition from the balance sheet to the shareholder – thereby making this efficient market framework perfectly compatible with the EDP.

We simply do not believe markets systematically value stocks this way. Markets are made up of many investors with different utility functions[12] and much market volatility is just noise. In fact, daily stock price volatility is on a similar order of magnitude as ex-dividend adjustments.[13] So we find it presumptuous, if not naïve, to assume markets operate this way when stock price volatility can mask the real mechanics of fundamentals and valuations.

Why is the EDP so prevalent?

The discussion above does not disprove the logic whereby some use the EDP as evidence that dividends and capital appreciation (or synthetic dividends) are equivalent. It merely pokes holes in one theory (our contrived market model) that would be sufficient to equate the two. To call this equivalence further into question, we highlight another theory that could explain the EDP, but still allows for the possibility of dividends being different.

Let us now consider the derivatives market. Unlike cash markets where the activity of buyers and sellers sets prices, most derivatives are priced by arbitrage. That is, their prices do not necessarily reflect traders’ expectations of how those derivatives will perform. Instead, their prices are determined by how much it costs to hedge the derivative risk.

A forward or future contract might serve as a good example. Think of a hypothetical stock XYZ with a current price of $100. The price of a future whereby the stock would be delivered one year from today has nothing to do with futures traders’ expectations for this stock. Instead, they think of the cost of delivering that stock to their counterparty with as little risk as possible. In this case, they borrow $100 at, say, 5% and purchase the stock. They plan to sit on it for a year and then deliver it to the other party. Knowing they will have to repay $105[14] to their creditor, they set the price of the future contract accordingly. Any other price (higher or lower) would leave an arbitrage opportunity on the table.

The key point here is that the derivative price is set by arbitrage assumptions – not market expectations. This introduces another duality; one could have a view on the price of a derivative that differs from the arbitrage price. For a futures contract, this discrepancy is less interesting since a view on the futures contract would effectively just be a view on the underlying. However, it can get more interesting with options or more complex derivative products. For example, Berkshire Hathaway sold some derivatives (basically insurance or put options on equity indices) where the arbitrage-determined prices were higher than their expectations.

The EDP may simply reflect arbitrage. If stocks did not adjust by the amount of the dividend, then there might be an arbitrage. Strictly speaking, the EDP would fall into the category of statistical arbitrage since prices could move overnight based on other factors – noise or real news. Even so, arbitrage theory represents a very plausible (likely in our view) explanation for the EDP.

As Figure 1 indicates (see this link for a more humorous example of confusing cause and correlation), it is not always obvious what the true driver of a particular result is when observing an event. In this case, the ex-dividend price drop clearly reflects the amount of the dividend to some extent. However, we believe it is a mistake to interpret this observation with too much precision. Given the nuances of dividend duality, magnitude of market noise, and the existence of arbitrage as an alternative explanation for the EDP, we find it presumptuous to conclude that dividends and synthetic dividends are equivalent.

Dividends are not always equivalent to buybacks

Let us first state that we agree that dividends are equivalent to buybacks when the dividends are reinvested. In this case, one ends up owning the same amount of book value as they would have had there been no dividend. Of course, taxes and the price one reinvests at[15] may alter things to some degree. However, the key element here is that both scenarios involve the purchase of book value at the same premium. This was not the case when we compared a reinvested dividend to a non-dividend payer.[16]

In the case where dividends are not reinvested in the same stock, dividends are not equivalent to buybacks. This follows from the distinction we made earlier regarding how income is generated. In the case dividends, investors receive a direct stream of cash flows directly from the companies, which makes any market volatility or noise irrelevant. In the case of buybacks, one will be at the mercy of the market when they go to sell shares to create their synthetic dividend. This market dependence makes buybacks intrinsically different than dividends.

Performance measures: Conflating the notions of dividends and capital appreciation

So far, much of this article has focused on understanding dividends and how they are different than capital appreciation. We made the distinction between whether dividends would be reinvested or not to clarify some of our arguments. We now highlight what we believe to be a better way to account for dividends in the context of retirees and other situations where dividends are spent and not reinvested.

For example, those in the accumulation phase (i.e., savers) may be more likely to reinvest dividends whereas those in the decumulation phase (i.e., retirees) might not be. This raises an interesting question regarding market performance calculations. In particular, is the total return (TR) or internal rate of return (IRR) calculation more appropriate?

Perhaps we are ignorant of the literature on the topic and we did not try hard enough to find relevant material, but we did not come across a paper or article that accurately reflected our perspective on the relevance of TR versus IRR for different investment purposes (i.e., saving versus retirement income).[17] Given our view that dividends are different (than, say, capital appreciation), we are naturally cautious about calculations that mix the two together.

The total return calculation conflates the notions of dividends and capital appreciation. When dividends are reinvested, they effectively ride on the back of future capital appreciation. So if one uses TR metrics, the information regarding the contribution from dividends is lost. In other words, you can use capital appreciation and dividends to calculate TR, but you cannot back out capital appreciation or dividend information from TR data.

This is why we believe IRR metrics can be useful – especially in the context where investment income will be spent rather than reinvested. IRR allows one to easily disentangle dividends from capital appreciation. Indeed, you start with an initial investment in a stock (or other asset). Then for any given period, you will have a stream of dividends and the terminal value of the stock at the end. You can calculate the IRR of the capital appreciation alone and then you can calculate the IRR with the dividends.

One might argue you could make similar calculations with and without dividends via TR. However, the key distinction here is that TR calculations depend on the trajectory of the share price – not just the terminal value. The IRR is not impacted if prices go up then down, down then up, or monotonically inch toward their final destination.

To be sure, TR calculations are convenient to use and are stored in thousands of databases. Virtually all academics and practitioners utilize TR for measuring stock performance. We suspect the bifurcation of the investment services industry between security selection and asset allocation[18] reinforces this trend. Indeed, investment advisors typically sift through the universe of funds and other investments based on TRs (and other technical measures like volatility, correlations, etc.) and build portfolios and asset allocations accordingly. So they effectively ignore dividends and that suits their needs.

As the British statistician George E.P. Box wrote, “All models are wrong but some are useful.” It is fine if dividends do not play a role in everyone’s models. However, we like to acknowledge the fundamental nature of dividends and the potential utility they can provide, especially in the context of retirement income. So we finish this section with some comparisons of the IRR and TR calculations. The first scenario is hypothetical and assumes share prices and dividends grow at a rate of 5%. The second scenario is based on S&P 500 data index over the last century (1918-2018). We think of this second scenario as a real-world sanity check for the results in our hypothetical scenario.

In a world where share prices and dividends grow by precisely 5% each year, the TR and IRR over every period is 10%. This is simply by construction. What is interesting is the difference between the dividend contributions as measured by TR vs IRR. Let us consider a 30-year period (not atypical for a retirement time horizon). The TR excluding dividends is 5% – again by construction. So that means dividends contributed 5% or half of the TR. However, the dividend contribution when measured by IRR was 7.6%. So the capital appreciation contributed just 2.4% when measured by IRR. If we extended the time period to 100 years, then the dividends claim an even larger share of the contribution – 9.95% of the total 10% return – when measured by IRR.

Figure 4: Dividend contribution depends on context (hypothetical portfolio)

Figure 4: Dividend contribution depends on context (hypothetical portfolio)

Source: Aaron Brask Capital (Robert Shiller’s online data)

Of course, the above scenario is contrived and the real world does not follow formulaic conventions. So let us look at the second scenario using real data. Over the last 30 years (1988-2018), the S&P 500 TR was approximately[19] 10.3% and dividends contributed 2.0% of this. During the same period, we calculated the IRR to be 11.1% with dividends contributing 5.9%.

Over the last 100 years (1918-2018), the S&P 500 TR was approximately 10.1% and dividends contributed 3.9% of this. During the same period, we calculated the IRR to be 10.0% with dividends contributing 9.8%.

Figure 5: Dividend contribution depends on context (S&P 500)

Figure 5: Dividend contribution depends on context (S&P 500)

Source: Aaron Brask Capital (Robert Shiller’s online data)

Of course, much of what we see in these results is just the mathematics of the starting dividend yield and subsequent growth (both dividends and capital appreciation). However, it should be evident that the contribution of dividends is relative – to both the context of the investor and the time frame. This is an important consideration when you come across claims regarding the importance of dividends or how much they contribute to overall market returns. Moreover, this analysis highlights the utility of the IRR metric when one wishes to truly isolate contributions from dividend versus capital appreciation.

Concluding remarks

Why did we write this article? Some might say we just like to quibble over pointless semantics. That is certainly not the case here (though the author is guilty of this sometimes). We are preparing the groundwork for future articles where we will articulate what we believe is a new and innovative retirement income strategy. Dividends are an essential component of this approach, but we simply prefer not to dilute that discussion.

This article addresses some misconceptions and mischaracterizations related to dividends. Some of these are likely the result of what we dub dividend duality. Indeed, dividends’ unique ability to straddle and pierce the corporate veil represents an anomaly that many market models may not be able to properly digest.

We may have beaten this horse to death, but the primary point of this article is to show that dividends are different. In some ways, this is negative (e.g., taxes and loss of valuation premium). In other ways, this can be positive. Given that dividends are direct transfers of assets (typically cash) from companies to shareholders, they can provide growing streams of income that are largely independent of market volatility.

It is important to understand there are different perspectives at play here. There is the decision by each company to pay a dividend (and/or buyback stock) or not. As the CEO of Berkshire Hathaway, Warren Buffett clearly prefers not to pay dividends. We understand his reasoning and do not disagree with his logic.

As investors, however, we are selecting stocks. Some pay dividends and some do not. Even those who are most critical of dividends seem to agree it is not sensible to let the dividend tail wag the dog. That is, dividends may have their disadvantages, but they are not so bad as to avoid them altogether.

Many credible approaches to investing and retirement income (e.g., factor models) still invest in dividend-paying stocks. Some even have higher dividend yields[20] and thus suffer more from the disadvantages we highlighted earlier. So these investment managers are clearly not avoiding dividends payers. We suspect they simply do not want to constrain their opportunity set (i.e., the universe they draw from) as it could have unintended consequences and potentially detract from performance (e.g., bias toward growth stocks which could underperform or be more volatile).

As a parting summary to help avoid ambiguity, here we layout several items we are and are not claiming:

What we are claiming:

  • Dividends are direct transfers of cash from companies to shareholders and effectively bypass market volatility.
  • Dividends are not always equivalent to capital appreciation or buybacks.
  • Dividend duality makes dividends less compatible with many existing market models.
What we are not claiming:

  • Dividend-paying stocks are better than non-dividend-paying stocks.
  • Dividends are free.
  • Dividends are the ultimate ‘arbiter of stock-market value’ (comment from James MacKintosh via the Wall Street Journal).

Disclaimer

  • This document is provided for informational purposes only.
  • We are not endorsing or recommending the purchase or sales of any security.
  • We have done our best to present statements of fact and obtain data from reliable sources, but we cannot guarantee the accuracy of any such information.
  • Our views and the data they are based on are subject to change at any time.
  • Investing involves risks and can result in permanent loss of capital.
  • Past performance is not necessarily indicative of future results.
  • We strongly suggest consulting an investment advisor before purchasing any security or investment.
  • Investments can trigger taxes. Investors should weight tax considerations and seek the advice of a tax professional.
  • Our research and analysis may only be quoted or redistributed under specific conditions:
    • Aaron Brask Capital has been consulted and granted express permission to do so (written or email).
    • Credit is given to Aaron Brask Capital as the source.
    • Content must be taken in its intended context and may not be modified to an extent that could possibly cause ambiguity of any of our analysis or conclusions.
  1. Technically, dividends may take the form of shares of cash, stock, or other property.
  2. It is possible for market conditions to impact dividend payout decisions. For example, corporate executives may see better opportunities (e.g., buybacks or acquisitions) or may be influenced by a ‘keeping up with the Joneses’ mindset relative to their competitors’ dividend policies. Moreover, buybacks impact future dividends by reducing shares outstanding. So lower or higher market prices could affect the number of shares repurchased and the amount of dividends paid on a per share basis.
  3. IPO = Initial public offering. This is the process by which a company can sell some of its equity to the public – after which it will have shares trading on a stock exchange.
  4. A synthetic (or homemade) dividend is a cash flow generated by selling some of one’s shares.
  5. Technically, dividend actually come out of the assets and retained earnings, but the result is a reduction in book value.
  6. This assumes no buybacks are taking place at the same time.
  7. In his example, Buffett relies on book value as a core fundamental metric and uses the price-to-book ratio for valuation (instead of, say, earnings and the price-to-earnings ratio). He also uses return on equity instead of return on assets or other variables. Some may question or alter these specific assumptions (even Buffett himself has questioned the validity of using book value), but we believe the thrust of the argument will still hold.
  8. Of course, taxes and transaction costs can be relevant.
  9. They calculate total returns. We discuss this performance calculation (and internal rates of return) later in the article.
  10. The wave-particle duality of light comes to mind – even if not a perfect analogy.
  11. Technically, the type of accruing we are referring to is not the same as with bonds where the seller of a bond retains accrued interest. In our scenario with dividends, the accrued dividend goes to the buyer. However, the share price might be valued lower to reflect the idle cash earmarked for the dividend.
  12. For example, there is much research showing how ex-dividend price trends are impacted by investors with different tax situations. Whether it is stocks, bonds, cash, bread, or butter, we all have different utility functions and this results in the transactions that make up our markets and economies.
  13. If a stock has an annualized volatility of 16%, then the volatility is approximately 1% on a daily basis. Given that dividend yields are around 2% and dividends are often paid quarterly, the ex-dividend adjustments are on the order on 0.5%.
  14. We assume no dividends are to be paid over this period.
  15. There could be a lag between when the stock trades ex-dividend and when investors can reinvest the proceeds (next morning).
  16. Recall that a dividend is transferred from the balance sheet to the investor dollar for dollar, but then purchases less book value of the company when reinvested, since stocks typically trade at a premium to book value.
  17. While they did not mention the investment context, one article we came across did at least highlight how total returns conflated the notions of dividends and capital appreciation.
  18. By security selection, we are referring to the activity conducted by funds and portfolio managers that buy and sell individual securities on a regular basis. These are people investors do not generally meet. Asset allocation is usually done by investment advisors or other financial professionals who deal directly with investors and help them sift through funds and other investments.
  19. This is only approximate because we are using Robert Shiller’s online data and had to make some assumptions regarding the timing and reinvestment of dividends.
  20. DFA’s flagship U.S. Large Cap Value Portfolio fund sports a dividend yield higher than that of the S&P 500 index (though lower than the S&P 500 value index). The point is that dividends may be ignored, but are not avoided.

Retirement Income Generation 101

The following is meant to be a quick summary of retirement income strategies. If you are interested in learning more, please contact me or read my longer and more detailed article on this topic.

Three options for retirement income

Introduction to Retirement Income

The stakes are high when it comes to retirement income. Unfortunately, salesmanship and conflicts of interest are rampant in the financial services industry. In most cases, the investment advice you receive will be a direct result of the type of financial professional you speak with (e.g., broker vs advisor vs insurance agent or a combination thereof). The purpose of this post is to help retirees and other investors see through the smoke and mirrors and make informed decisions in the context of generating retirement income.

My goal here is to provide a  high-level overview of the primary options available to generate retirement income – not to go into the granular details. I believe the information below should be enough to help you narrow down your choices so you can start exploring and refining the most appropriate options.

Note: This post only discusses retirement income, but it is also important to make sure your plan is tax-efficient and minimize the likelihood or impact of unexpected events that could jeopardize your financial security. One should conduct more comprehensive planning to address these issues.

Executive Summary

  • Living off dividends and interest: One requires substantial wealth to live off of natural portfolio income and avoid dipping into principal (e.g., 30-50x your annual spending budget in a world with yields around 2-3%).
  • Safe withdrawal rates: Maintain a balanced portfolio and generate synthetic retirement income by chiseling from the portfolio. This naturally involves high dependence on market performance. Fees can range from low to high (e.g., 0.10% – 2.5% per year) depending on how the strategy is executed.
  • Annuities: The primary benefit of these products is that they have the ability to guarantee streams of income for as long as you live. Some annuities have excessive fees (e.g., 3-4% per year!) and can result in higher taxes. Unfortunately, big commissions encourage brokers to sell many of the more expensive and tax-inefficient products.
  • Structured Investment Income (SII): A potentially safer, simpler, and lower-fee hybrid strategy that can maximize retirement income and performance through efficient risk management. Our intuitive Set It and Leave It™ approach targets annual fees of just 0.10% (10 basis points) per year, is incredibly tax-efficient, and requires little, if any, maintenance.

Four Primary Strategies for Retirement Income

Below I identify what I believe are the four primary strategies for investors to use their savings to generate retirement income. Each approach has pros and cons in terms of security, level of income, fees, liquidity, legacy goals (e.g., heirs or charities), etc. Each person naturally has unique perspectives, experiences, preferences, and priorities. So there is no one-size-fits-all answer. However, I suspect the attributes I highlight below can help you narrow down your choices.

Note: I left out the ‘pillowcase’ option whereby one could simply stash their cash in their pillow or bank account and take money out as they need. The math behind this situation is relatively simple (e.g., spending a $100,000 per year for 40 years requires $4 million). However, this approach is still subject to the risks related to inflation and longer than expected longevity (i.e., running out of money) – two specific concerns I address below.


Option #1: Living off dividends and interest

The first option is to buy a portfolio of stocks and bonds and then live off the income they provide – dividends and interest. The goal here is to live off the natural income streams these assets throw off without dipping into the principal. In addition to simplifying one’s income strategy, this can also reduce one’s dependency on market price performance.

Note: In my experience, the stability of dividend income surprises most people. I suspect many assume dividends are volatile because market prices are. However, this is not necessarily the case as I discuss in my Destroying Steady Income article.

The obvious challenge here is having enough wealth to generate the income you need. Given the current low rates of interest and dividends (as of September 2016, dividend and bond yields are in the range of 2-3%), this requires savings on the order of 30-50x your annual spending budget. If your annual expenses are, say, $100,000, then you will need approximately $3-5 million to comfortably rely on dividends and interest without accessing the principal (absent other sources of income).

Real estate?

Of course, real estate and other income-generating investments can work too. Rental yields from real estate, for example, are typically higher (perhaps due to the lack of liquidity, potential headaches involved, or slower growth rates relative to stocks). Real estate transactions typically take weeks or months and involve significant transaction (e.g., closing) costs. Moreover, maintaining a property or dealing with tenants might be too much for many to handle.

Notwithstanding these potential issues, it is possible to find real estate investments generating reliable yields of 4% or higher.  Of course, real estate investments can be leveraged to boost the yields even higher (e.g., upper single digits). In this case, the quality of the cash flows generated by the properties is paramount. Whether you own the property yourself or through another party (e.g., manager or fund) with leverage, you do not want to miss an interest payment or your investment could evaporate.

The bottom line: Suffice to say, not many folks fall into the category of being able to live off their dividends and interest alone. However, you need not despair. Option #4  below (Structured Investment Income) provides a blueprint for how to structure a similar solution for income.


Option #2: Safe withdrawal rates (SWR)

Building a balanced portfolio (e.g., 60% stocks and 40% bonds) and chiseling off principal is probably the most popular approach to generating income for retirement. The idea is to estimate how much one can safely withdraw without jeopardizing financial security down the road – hence the safe withdrawal rate (SWR) label.

William Bengen, an MIT rocket scientist who went into financial planning, is credited with the seminal research on the topic of SWR income strategies. He ran historical simulations and illustrated the interplay between portfolio allocations, SWRs, and wealth depletion. He is also credited with coming up with the 4% rule. This rule of thumb suggests investors with balanced portfolios should be able to withdraw 4% of the original balance in the first year and then the same amount adjusted by inflation each year thereafter. In particular, his simulations indicated this strategy very rarely resulted in wealth depletion.

Issues with SWR Strategies

In my view, there are two issues with SWR strategies. The first issue is market dependence. No matter how many simulations or statistical analyses you run, markets may not behave the way they have in the past or how your simulations assume they will. I find this notion to be discomforting since past performance is not necessarily indicative of future performance.

The second issue I identify with SWR strategies relates to the fees. I see many instances where investors are paying investment advisors to execute these strategies. For example, consider a 1% advisor fee and a withdrawal rate around the 4% rule of thumb. You would effectively be sharing a quarter of your retirement with your advisor.

Truth be told, SWR strategies are fairly straightforward to execute once they have been set up. All one has to do is periodically rebalance the portfolio to match the specified allocations and generate the desired income. Indeed, there are now many robo-advisors who do this for low or no cost. This is not to say advisors cannot add value in other ways.

For example, I believe it is important to tactically alter the allocations to reflect different market conditions. Value-adding strategies like this can earn an advisor’s fee many times over. However, this is not the norm for most advisors who employ a reactive rebalancing process based on what markets have already done.


Option #3: Annuities

The above SWR approach clearly involves a significant degree of market risk. Moreover, standard investments are not aware of your lifespan. One way to address these risks is to purchase products which guarantee income as long as you live. We call these products annuities and only insurance companies can sell them (since they are institutions that manage longevity risk). Without doubt, guaranteed income is a highly attractive and desirable feature.

Note: Insurance companies can run into trouble too as many did during the financial crisis. However, they are highly regulated and many states effectively step in to guarantee annuity products if carriers have financial issues. In my view, this makes the risk of defaulting on their guaranteed payments minimal.

Tax Benefits

Another benefit annuity products can offer is tax-deferral. In particular, investments can grow and one can make changes to the underlying portfolios without triggering capital gains. In general, tax-deferral can provide immense benefits. However, the net earnings are ultimately taxed as income tax (which is generally much higher than capital gains rates) when the owner eventually withdraws those funds. This is a significant issue in taxable accounts.

Without doubt, income that is guaranteed to last throughout one’s lifetime and tax-deferral are very desirable in the eyes of risk-averse investors looking to secure their financial well-being. So insurance agents are able to make very compelling marketing pitches. However, it is important to weigh the benefits with the associated costs and constraints.

Some annuities (e.g., variable annuities) have fees as high as 4% or more per year and may involve lockups or surrender periods whereby one cannot sell their annuity for several years without paying significant penalties. Suffice to say, people selling annuities do not always focus on these items.

The bottom line

Annuities are unique in being able to make guarantees related to income and longevity. However, annuity salespeople often like to sell the higher fee products because they get bigger commissions. At the end of the day, you have to work out the math and balance the risks to see how they compare to other income strategies. For example, fixed annuities strip out many of the bells and whistles to isolate the core benefits of lifelong income and tax-deferral. As a result, these products typically have much lower costs than their variable annuity cousins.

[accordions]

[accordion title=”Learn more about annuities”]

Learn more about annuities

I have had extensive experience analyzing annuities on both the consumer side working with individual investors and (earlier in my career) on behalf of insurance companies looking to hedge their annuity businesses. In my experience, the fees most (but not all) of these products charge outweigh the benefits they provide. These products involve much financial engineering, so the math is often difficult to untangle. However, the basic logic is straightforward.

An insurance company is an intermediary between you and the market. They provide a service (aggregating and hedging risk) which costs them money and then they tack on their profits on top of those costs. They must also educate and incentivize (via commissions) armies of salespeople to sell their products – a costly endeavor to be sure. At the end of the day, all of these costs add up and ultimately come out the pockets of people who purchase these products.

Keep an Eye on Costs

While we do not know the precise costs or profits embedded in many of these products, there is another way to estimate how much of your money goes toward the costs above (and thus how much of your investment is left to work for you). You can simply add up the annual fees over the expected lifetime of the product. For example, if the annual fees are 2.75% and you plan to hold the product for at least 10 years, then you will lose approximately 27.5% (10 x 2.75%) of your original investment to these fees. Just 72.5 cents of each dollar will will be working for you.

The fee example I used above is admittedly on the higher end of the spectrum (but not the highest I have seen!). There are many different types of annuities with varying costs. In general, the fancier products have higher costs and the simpler products have lower costs.

Two Options for Lifelong Income

Now that I have made my views clear about annuity fees (beaten the horse to death?), I will now highlight two different annuity products that guarantee lifelong streams of income. The first is a variable annuity with a guaranteed lifetime withdrawal benefit (GLWB). A variable annuity is effectively a retirement vehicle which invests your money in various funds and allows the earnings to grow tax-deferred (though ordinary income tax applies to the returns when they come out).

When one also purchases the GLWB for the annuity, there is a guaranteed minimum level of annual withdrawals (e.g., 5% of the original investment) as long as they are alive. While the minimum level of withdrawal is guaranteed from day one, this minimum level can also increase (but not decrease) through time if the performance of the portfolio reaches certain hurdle rates. In other words, this product can both guarantee a minimum level of income but also allow for some upside if the underlying portfolio performs well.

In addition to the GLWB, there are many other options (called riders) investors can add to their annuity contracts (for additional fees) – enough to make most heads spin. On balance, the wide array of features, riders, payouts, and embedded costs make variable annuities fairly complex. So I am never surprised when I meet people with variable annuity contracts they do not understand.

The SPIA

Now I will discuss an annuity product which is on the opposite side of the complexity spectrum: the single premium immediate annuity (SPIA). This product simply converts a lump sum of cash investment into a guaranteed lifelong stream of income (e.g., 7% of the original investment). When discussing these products, many folks are quick to ask “What if I get hit by a bus the day after I sign the contract?“. Luckily, there are fairly inexpensive options that can add guarantees relating to the minimum number of years of payments or total amount of payout that is guaranteed.

There are some important distinctions between the two products I have discussed. For example, variable annuities are more complex (hence the multiple paragraphs to describe them versus just one for the SPIA). In terms of income, the guaranteed payouts of the variable annuities with GLWB rider are typically lower than for SPIAs. However, variable products provide potential upside to the guaranteed payments. Moreover, they may also leave some money left over for at the end (i.e., for beneficiaries).

On balance, annuities can offer some attractive features such as guaranteed income and tax-deferral. However, investors must weigh these and other benefits against their costs. This is the only way to figure out which of these products (if any) are suitable for their financial plan.

If you would like to learn more about annuities, please contact me or read my longer article that includes more details.

[/accordion]

[/accordions]


Option #4: Structured Investment Income (SII)

This section describes my Structured Investment Income (SII) approach. It is a hybrid of the SWR strategy and annuity products discussed above. This approach targets the primary advantages of both strategies (reliable income, liquidity, and capital growth). However, it also addresses two of their major drawbacks (costs and market dependency). On balance, I believe SII is a much simpler strategy and allows investors to enjoy more peace of mind.

I target total fees and costs around 0.10% per year (i.e., 10bps per year). That is just a fraction of the costs associated with most retirement strategies. Moreover, SII can be significantly more tax-efficient as well. Please contact me to learn more.

As I highlighted above, very few people have enough money to live off interest and dividends. In other words, they will have to dig into principal. This is precisely what happens with annuities and SWR strategies – even if it is not evident. The constant gravity of fees may be subtle and market volatility may obscure the trend. However, principal erosion is a certainty for those who cannot live off the natural income generated by their portfolio.

What is SII?

So what is my SII approach? The easiest way to understand SII is to consider a hypothetical example. Let us say Jane Retiree is 65 years old and has $2 million in savings. Furthermore, she expects to spend $100,000 a year in retirement. So her current spending budget is 5% of her portfolio (=$100k/$2m), but will likely increase with inflation. Unfortunately, 5% is higher than the 2-3% yields on stocks and bonds. Moreover, it is higher than the 4%  ‘rule of thumb’ discussed above. In other words, she cannot live off the dividends and interest. Thus, traditional SWR strategies would run a higher risk of capital depletion.

[accordions]

[accordion title=”Example: Jane Retiree”]

Example: Jane Retiree

So let us consider changing the SWR approach. We could replace the bond allocation with a SPIA (single premium immediate annuity). Please see the ‘Annuities’ section above for more information). In practice, we generally do not purchase a SPIA. We often purchase a series of CDs and bonds first. This creates a stream of fixed cash flows going out, say, 10-15 years. Then we would purchased a deferred income annuity (DIA) that would start paying when these CDs and bonds left off. The CDs, bonds, and DIA would create a level stream of payments continuing for as long as she lives. So this would effectively create the same income stream as a SPIA. However,  it would also maintain more liquidity via access to the CDs and bonds.

At Jane’s age, a SPIA might payout around 7% per year. If half of her $2m portfolio was allocated to SPIAs, this would generate $70,000 of income per year. Then the other half could be in stocks paying a current dividend yield of, say, 3%. This provides another $30,000 per year in dividends (which should grow at a rate higher than inflation). Et voila! Jane now has a portfolio that generates sufficient income for her retirement needs ($100,000). Moreover, it should grow over time and help address inflation risk.

Chiseling vs SII

If Jane had to chisel away from her portfolio, then she would be at the mercy of the market. However, Jane’s income is now naturally generated via fixed income and dividends. It is important to understand that dividends are far volatile than market prices and there are many companies who have paid and increased dividends for many years – even through the last two recessions and market collapses.

With a strategy like this, Jane does not need to worry as much about stock market volatility. Moreover, there is little to no need to manage the portfolio. So she may not need an advisor to manage her portfolio once this is set up. As a result, this can translate into significant savings. For example, consider an ongoing advisor fee of 1% per year. That  would consume approximately 20% of her retirement income (1% x $2m = $20,000 out of her $100,000 of income).

[/accordion]

[/accordions]

SII Simplicity

As the above example illustrates, the SII approach is remarkably simple. It can produce a reliable source of income (dividends and guaranteed SPIA payments) with reduced dependency on market performance. It can also eliminate many of the annual fees and taxes associated with the bond allocation. This is particularly relevant when comparing to a variable annuity or SWR strategy. However, SII has other benefits we have not yet discussed. SII can help minimize tax friction and maximize performance. This can translate into more income or residual wealth for legacy purposes (e.g., heirs or charities).

SII Tax Efficiency

There are three ways SII can help minimize taxes. The first way is that it involves significantly less, if any, portfolio rebalancing. Thus, it should trigger fewer capitals gains. Second, the investor effectively consumes the fixed income side of the portfolio throughout retirement (but is guaranteed not to run out!). So much of the income is actually principal and thus not taxable. Moreover, this also means that the fixed income allocation decreases through time. This is good because fixed income is generally less tax-inefficient given that ordinary income tax applies to the interest. The third tax benefit of SII stems from the use of the fixed annuity. These products defer all of the taxes until the owner starts to receive income.

Our calculations indicate these tax benefits can save many retirees the better part of 1% per year. To put this into context, consider tax savings of 0.50% per year versus a 5% withdrawal rate. This amounts to a 10% boost to retirement income via tax savings alone (10% = 0.50% / 5%).

SII Performance Advantage

SII also offers potential performance advantages. These stem from the different ways one has to manage (or not manage) the portfolio. Most other strategies rebalance and maintain fixed asset allocations (e.g., 60%/40%). They generally have to do this because their income stream is dependent on market performance. Specifically, they must keep a lid on overall volatility. Otherwise, they would risk opening the door to wealth depletion and income impairment.

Unfortunately, this rebalancing process can limit overall portfolio performance as it systematically constrains the higher growth asset (e.g., stocks). Each time stocks outpace the other investments, the SWR strategy trims the equity allocation. Then the proceeds are redistributed to other parts of the portfolio (presumably triggering taxes as well). In the words of famed investor Peter Lynch, this process is akin to “trimming your flowers and watering your weeds.”

Another Tax Angle

There is another advantage to using the fixed income side of the portfolio to secure enough income via the SPIA. It leaves the equity side of the portfolio alone to grow without constraint. In terms of risk management, this transfers risk away from the retiree’s income stream and to the retiree’s beneficiaries. This is a much better alignment as equity risk then resides with their presumably longer time horizons. Of course, a retiree may wish to take advantage of the equity growth within their lifetime. In that case, they could sell some of their equity allocation along the way. However, this would not done in such a way to systematically constrain growth and trigger taxes.

The bottom line: The above description and example brush some details under the rug (e.g., inflation). The overall approach of marrying an income annuity to a stream of dividends offers many potential benefits. First, it is both simple and efficient means to generate a robust and growing stream of income. I find SII offers the best balance of income, risk, cost, tax, and performance. As a result, I believe this approach to income produces can provide significantly more peace of mind in retirement.